See a Map of Bay Area Hazardous Sites at Risk From Rising Seas
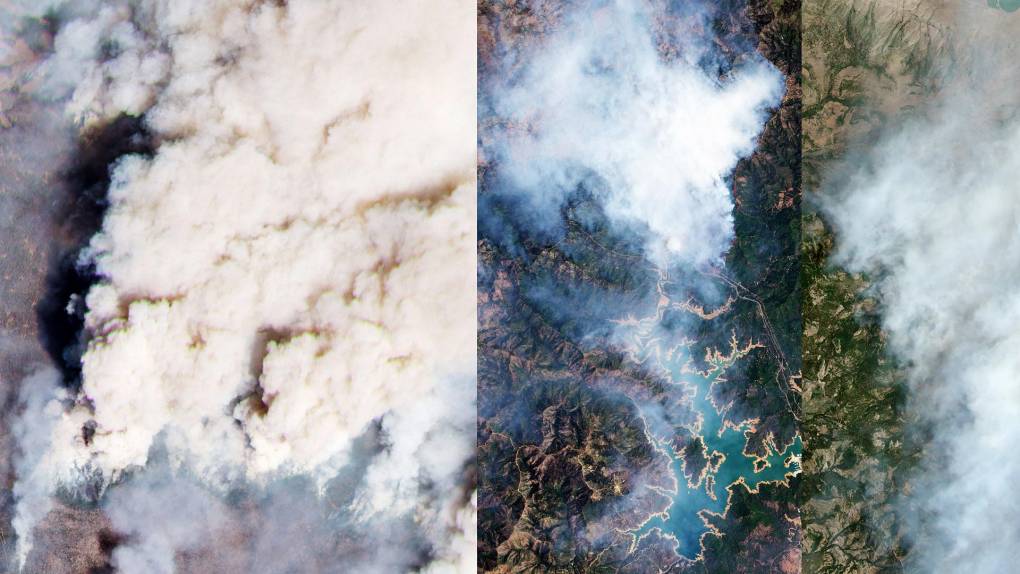
A Harrowing California Fire Season is Here, Fueled by Historic Drought
QUIZ: Planning Travel This Summer? How to Keep Your COVID Risk Low
Mapa: Descubre cuáles lugares del Área de la Bahía están en riesgo de inundación por el aumento del nivel del mar
Maps: See Which Bay Area Locations Are at Risk From Rising Seas
QUIZ: Planning a Summer Trip to Visit Family? Check Your COVID-19 Travel Risk
CHARTS: Here Are the Trendlines for COVID-19 Deaths and Hospitalizations in Each Bay Area County
MAP: See Which Bay Area Nursing Homes and Long-term Care Facilities Have Had Coronavirus Outbreaks
Bay Area Coronavirus Hospitalizations and Cases Appear Flat, Key Metrics for Reopening
Player sponsored by
window.__IS_SSR__=true
window.__INITIAL_STATE__={
"attachmentsReducer": {
"audio_0": {
"type": "attachments",
"id": "audio_0",
"imgSizes": {
"kqedFullSize": {
"file": "https://ww2.kqed.org/news/wp-content/themes/KQED-unified/img/audio_bgs/background0.jpg"
}
}
},
"audio_1": {
"type": "attachments",
"id": "audio_1",
"imgSizes": {
"kqedFullSize": {
"file": "https://ww2.kqed.org/news/wp-content/themes/KQED-unified/img/audio_bgs/background1.jpg"
}
}
},
"audio_2": {
"type": "attachments",
"id": "audio_2",
"imgSizes": {
"kqedFullSize": {
"file": "https://ww2.kqed.org/news/wp-content/themes/KQED-unified/img/audio_bgs/background2.jpg"
}
}
},
"audio_3": {
"type": "attachments",
"id": "audio_3",
"imgSizes": {
"kqedFullSize": {
"file": "https://ww2.kqed.org/news/wp-content/themes/KQED-unified/img/audio_bgs/background3.jpg"
}
}
},
"audio_4": {
"type": "attachments",
"id": "audio_4",
"imgSizes": {
"kqedFullSize": {
"file": "https://ww2.kqed.org/news/wp-content/themes/KQED-unified/img/audio_bgs/background4.jpg"
}
}
},
"placeholder": {
"type": "attachments",
"id": "placeholder",
"imgSizes": {
"thumbnail": {
"file": "https://cdn.kqed.org/wp-content/uploads/2024/12/KQED-Default-Image-816638274-2000x1333-1-160x107.jpg",
"width": 160,
"height": 107,
"mimeType": "image/jpeg"
},
"medium": {
"file": "https://cdn.kqed.org/wp-content/uploads/2024/12/KQED-Default-Image-816638274-2000x1333-1-800x533.jpg",
"width": 800,
"height": 533,
"mimeType": "image/jpeg"
},
"medium_large": {
"file": "https://cdn.kqed.org/wp-content/uploads/2024/12/KQED-Default-Image-816638274-2000x1333-1-768x512.jpg",
"width": 768,
"height": 512,
"mimeType": "image/jpeg"
},
"large": {
"file": "https://cdn.kqed.org/wp-content/uploads/2024/12/KQED-Default-Image-816638274-2000x1333-1-1020x680.jpg",
"width": 1020,
"height": 680,
"mimeType": "image/jpeg"
},
"1536x1536": {
"file": "https://cdn.kqed.org/wp-content/uploads/2024/12/KQED-Default-Image-816638274-2000x1333-1-1536x1024.jpg",
"width": 1536,
"height": 1024,
"mimeType": "image/jpeg"
},
"fd-lrg": {
"file": "https://cdn.kqed.org/wp-content/uploads/2024/12/KQED-Default-Image-816638274-2000x1333-1-1536x1024.jpg",
"width": 1536,
"height": 1024,
"mimeType": "image/jpeg"
},
"fd-med": {
"file": "https://cdn.kqed.org/wp-content/uploads/2024/12/KQED-Default-Image-816638274-2000x1333-1-1020x680.jpg",
"width": 1020,
"height": 680,
"mimeType": "image/jpeg"
},
"fd-sm": {
"file": "https://cdn.kqed.org/wp-content/uploads/2024/12/KQED-Default-Image-816638274-2000x1333-1-800x533.jpg",
"width": 800,
"height": 533,
"mimeType": "image/jpeg"
},
"post-thumbnail": {
"file": "https://cdn.kqed.org/wp-content/uploads/2024/12/KQED-Default-Image-816638274-2000x1333-1-672x372.jpg",
"width": 672,
"height": 372,
"mimeType": "image/jpeg"
},
"twentyfourteen-full-width": {
"file": "https://cdn.kqed.org/wp-content/uploads/2024/12/KQED-Default-Image-816638274-2000x1333-1-1038x576.jpg",
"width": 1038,
"height": 576,
"mimeType": "image/jpeg"
},
"xxsmall": {
"file": "https://cdn.kqed.org/wp-content/uploads/2024/12/KQED-Default-Image-816638274-2000x1333-1-160x107.jpg",
"width": 160,
"height": 107,
"mimeType": "image/jpeg"
},
"xsmall": {
"file": "https://cdn.kqed.org/wp-content/uploads/2024/12/KQED-Default-Image-816638274-2000x1333-1-672x372.jpg",
"width": 672,
"height": 372,
"mimeType": "image/jpeg"
},
"small": {
"file": "https://cdn.kqed.org/wp-content/uploads/2024/12/KQED-Default-Image-816638274-2000x1333-1-672x372.jpg",
"width": 672,
"height": 372,
"mimeType": "image/jpeg"
},
"xlarge": {
"file": "https://cdn.kqed.org/wp-content/uploads/2024/12/KQED-Default-Image-816638274-2000x1333-1-1020x680.jpg",
"width": 1020,
"height": 680,
"mimeType": "image/jpeg"
},
"full-width": {
"file": "https://cdn.kqed.org/wp-content/uploads/2024/12/KQED-Default-Image-816638274-2000x1333-1-1920x1280.jpg",
"width": 1920,
"height": 1280,
"mimeType": "image/jpeg"
},
"guest-author-32": {
"file": "https://cdn.kqed.org/wp-content/uploads/2025/01/KQED-Default-Image-816638274-1333x1333-1-160x160.jpg",
"width": 32,
"height": 32,
"mimeType": "image/jpeg"
},
"guest-author-50": {
"file": "https://cdn.kqed.org/wp-content/uploads/2025/01/KQED-Default-Image-816638274-1333x1333-1-160x160.jpg",
"width": 50,
"height": 50,
"mimeType": "image/jpeg"
},
"guest-author-64": {
"file": "https://cdn.kqed.org/wp-content/uploads/2025/01/KQED-Default-Image-816638274-1333x1333-1-160x160.jpg",
"width": 64,
"height": 64,
"mimeType": "image/jpeg"
},
"guest-author-96": {
"file": "https://cdn.kqed.org/wp-content/uploads/2025/01/KQED-Default-Image-816638274-1333x1333-1-160x160.jpg",
"width": 96,
"height": 96,
"mimeType": "image/jpeg"
},
"guest-author-128": {
"file": "https://cdn.kqed.org/wp-content/uploads/2025/01/KQED-Default-Image-816638274-1333x1333-1-160x160.jpg",
"width": 128,
"height": 128,
"mimeType": "image/jpeg"
},
"detail": {
"file": "https://cdn.kqed.org/wp-content/uploads/2025/01/KQED-Default-Image-816638274-1333x1333-1-160x160.jpg",
"width": 160,
"height": 160,
"mimeType": "image/jpeg"
},
"kqedFullSize": {
"file": "https://cdn.kqed.org/wp-content/uploads/2024/12/KQED-Default-Image-816638274-2000x1333-1.jpg",
"width": 2000,
"height": 1333
}
}
},
"science_1984388": {
"type": "attachments",
"id": "science_1984388",
"meta": {
"index": "attachments_1716263798",
"site": "science",
"id": "1984388",
"found": true
},
"parent": 0,
"imgSizes": {
"twentyfourteen-full-width": {
"file": "https://ww2.kqed.org/app/uploads/sites/35/2023/09/2100-1038x576.jpg",
"width": 1038,
"mimeType": "image/jpeg",
"height": 576
},
"thumbnail": {
"file": "https://ww2.kqed.org/app/uploads/sites/35/2023/09/2100-160x90.jpg",
"width": 160,
"mimeType": "image/jpeg",
"height": 90
},
"post-thumbnail": {
"file": "https://ww2.kqed.org/app/uploads/sites/35/2023/09/2100-672x372.jpg",
"width": 672,
"mimeType": "image/jpeg",
"height": 372
},
"kqedFullSize": {
"file": "https://ww2.kqed.org/app/uploads/sites/35/2023/09/2100.jpg",
"width": 1920,
"height": 1080
},
"large": {
"file": "https://ww2.kqed.org/app/uploads/sites/35/2023/09/2100-1020x574.jpg",
"width": 1020,
"mimeType": "image/jpeg",
"height": 574
},
"1536x1536": {
"file": "https://ww2.kqed.org/app/uploads/sites/35/2023/09/2100-1536x864.jpg",
"width": 1536,
"mimeType": "image/jpeg",
"height": 864
},
"medium": {
"file": "https://ww2.kqed.org/app/uploads/sites/35/2023/09/2100-800x450.jpg",
"width": 800,
"mimeType": "image/jpeg",
"height": 450
},
"medium_large": {
"file": "https://ww2.kqed.org/app/uploads/sites/35/2023/09/2100-768x432.jpg",
"width": 768,
"mimeType": "image/jpeg",
"height": 432
}
},
"publishDate": 1695498035,
"modified": 1695498035,
"caption": null,
"description": null,
"title": "2100",
"credit": null,
"status": "inherit",
"altTag": null,
"isLoading": false,
"fetchFailed": false
},
"science_1975845": {
"type": "attachments",
"id": "science_1975845",
"meta": {
"index": "attachments_1716263798",
"site": "science",
"id": "1975845",
"found": true
},
"parent": 0,
"imgSizes": {
"twentyfourteen-full-width": {
"file": "https://ww2.kqed.org/app/uploads/sites/35/2021/07/FI_FINAL_PUNCA-1038x576.jpg",
"width": 1038,
"mimeType": "image/jpeg",
"height": 576
},
"thumbnail": {
"file": "https://ww2.kqed.org/app/uploads/sites/35/2021/07/FI_FINAL_PUNCA-160x90.jpg",
"width": 160,
"mimeType": "image/jpeg",
"height": 90
},
"post-thumbnail": {
"file": "https://ww2.kqed.org/app/uploads/sites/35/2021/07/FI_FINAL_PUNCA-672x372.jpg",
"width": 672,
"mimeType": "image/jpeg",
"height": 372
},
"kqedFullSize": {
"file": "https://ww2.kqed.org/app/uploads/sites/35/2021/07/FI_FINAL_PUNCA.jpg",
"width": 1920,
"height": 1080
},
"large": {
"file": "https://ww2.kqed.org/app/uploads/sites/35/2021/07/FI_FINAL_PUNCA-1020x574.jpg",
"width": 1020,
"mimeType": "image/jpeg",
"height": 574
},
"1536x1536": {
"file": "https://ww2.kqed.org/app/uploads/sites/35/2021/07/FI_FINAL_PUNCA-1536x864.jpg",
"width": 1536,
"mimeType": "image/jpeg",
"height": 864
},
"medium": {
"file": "https://ww2.kqed.org/app/uploads/sites/35/2021/07/FI_FINAL_PUNCA-800x450.jpg",
"width": 800,
"mimeType": "image/jpeg",
"height": 450
},
"medium_large": {
"file": "https://ww2.kqed.org/app/uploads/sites/35/2021/07/FI_FINAL_PUNCA-768x432.jpg",
"width": 768,
"mimeType": "image/jpeg",
"height": 432
}
},
"publishDate": 1626556024,
"modified": 1626624778,
"caption": "Bootleg Fire, Oregon; Salt Fire, California; Beckwourth Complex, California.",
"description": null,
"title": "Punishing Fires",
"credit": "Images provided by Planet Labs",
"status": "inherit",
"altTag": "Punishing Fires",
"isLoading": false,
"fetchFailed": false
},
"science_1975003": {
"type": "attachments",
"id": "science_1975003",
"meta": {
"index": "attachments_1716263798",
"site": "science",
"id": "1975003",
"found": true
},
"parent": 1974894,
"imgSizes": {
"twentyfourteen-full-width": {
"file": "https://ww2.kqed.org/app/uploads/sites/35/2021/05/RS49554_GettyImages-1232612465-qut-1038x576.jpg",
"width": 1038,
"mimeType": "image/jpeg",
"height": 576
},
"thumbnail": {
"file": "https://ww2.kqed.org/app/uploads/sites/35/2021/05/RS49554_GettyImages-1232612465-qut-160x107.jpg",
"width": 160,
"mimeType": "image/jpeg",
"height": 107
},
"post-thumbnail": {
"file": "https://ww2.kqed.org/app/uploads/sites/35/2021/05/RS49554_GettyImages-1232612465-qut-672x372.jpg",
"width": 672,
"mimeType": "image/jpeg",
"height": 372
},
"kqedFullSize": {
"file": "https://ww2.kqed.org/app/uploads/sites/35/2021/05/RS49554_GettyImages-1232612465-qut.jpg",
"width": 1920,
"height": 1281
},
"large": {
"file": "https://ww2.kqed.org/app/uploads/sites/35/2021/05/RS49554_GettyImages-1232612465-qut-1020x681.jpg",
"width": 1020,
"mimeType": "image/jpeg",
"height": 681
},
"1536x1536": {
"file": "https://ww2.kqed.org/app/uploads/sites/35/2021/05/RS49554_GettyImages-1232612465-qut-1536x1025.jpg",
"width": 1536,
"mimeType": "image/jpeg",
"height": 1025
},
"medium": {
"file": "https://ww2.kqed.org/app/uploads/sites/35/2021/05/RS49554_GettyImages-1232612465-qut-800x534.jpg",
"width": 800,
"mimeType": "image/jpeg",
"height": 534
},
"medium_large": {
"file": "https://ww2.kqed.org/app/uploads/sites/35/2021/05/RS49554_GettyImages-1232612465-qut-768x512.jpg",
"width": 768,
"mimeType": "image/jpeg",
"height": 512
}
},
"publishDate": 1622231510,
"modified": 1622231593,
"caption": "People enter Disneyland Park as it reopens on April 30 for the first time since the COVID 19 pandemic forced the park to shut down last year. ",
"description": null,
"title": "Disneyland Reopens For First Time Since Beginning Of Pandemic",
"credit": "David McNew/Getty Images",
"status": "inherit",
"altTag": null,
"isLoading": false,
"fetchFailed": false
},
"science_1974298": {
"type": "attachments",
"id": "science_1974298",
"meta": {
"index": "attachments_1716263798",
"site": "science",
"id": "1974298",
"found": true
},
"parent": 1974195,
"imgSizes": {
"twentyfourteen-full-width": {
"file": "https://ww2.kqed.org/app/uploads/sites/35/2021/04/Bay-Area-Sea-Level-Rise-1038x576.jpg",
"width": 1038,
"mimeType": "image/jpeg",
"height": 576
},
"thumbnail": {
"file": "https://ww2.kqed.org/app/uploads/sites/35/2021/04/Bay-Area-Sea-Level-Rise-160x90.jpg",
"width": 160,
"mimeType": "image/jpeg",
"height": 90
},
"post-thumbnail": {
"file": "https://ww2.kqed.org/app/uploads/sites/35/2021/04/Bay-Area-Sea-Level-Rise-672x372.jpg",
"width": 672,
"mimeType": "image/jpeg",
"height": 372
},
"kqedFullSize": {
"file": "https://ww2.kqed.org/app/uploads/sites/35/2021/04/Bay-Area-Sea-Level-Rise.jpg",
"width": 1920,
"height": 1080
},
"large": {
"file": "https://ww2.kqed.org/app/uploads/sites/35/2021/04/Bay-Area-Sea-Level-Rise-1020x574.jpg",
"width": 1020,
"mimeType": "image/jpeg",
"height": 574
},
"1536x1536": {
"file": "https://ww2.kqed.org/app/uploads/sites/35/2021/04/Bay-Area-Sea-Level-Rise-1536x864.jpg",
"width": 1536,
"mimeType": "image/jpeg",
"height": 864
},
"medium": {
"file": "https://ww2.kqed.org/app/uploads/sites/35/2021/04/Bay-Area-Sea-Level-Rise-800x450.jpg",
"width": 800,
"mimeType": "image/jpeg",
"height": 450
},
"medium_large": {
"file": "https://ww2.kqed.org/app/uploads/sites/35/2021/04/Bay-Area-Sea-Level-Rise-768x432.jpg",
"width": 768,
"mimeType": "image/jpeg",
"height": 432
}
},
"publishDate": 1619627230,
"modified": 1619627248,
"caption": null,
"description": null,
"title": "El aumento del nivel del mar en el Área de la Bahía",
"credit": null,
"status": "inherit",
"altTag": null,
"isLoading": false,
"fetchFailed": false
},
"science_1984386": {
"type": "attachments",
"id": "science_1984386",
"meta": {
"index": "attachments_1716263798",
"site": "science",
"id": "1984386",
"found": true
},
"parent": 0,
"imgSizes": {
"twentyfourteen-full-width": {
"file": "https://ww2.kqed.org/app/uploads/sites/35/2023/09/2050-1038x576.jpg",
"width": 1038,
"mimeType": "image/jpeg",
"height": 576
},
"thumbnail": {
"file": "https://ww2.kqed.org/app/uploads/sites/35/2023/09/2050-160x90.jpg",
"width": 160,
"mimeType": "image/jpeg",
"height": 90
},
"post-thumbnail": {
"file": "https://ww2.kqed.org/app/uploads/sites/35/2023/09/2050-672x372.jpg",
"width": 672,
"mimeType": "image/jpeg",
"height": 372
},
"kqedFullSize": {
"file": "https://ww2.kqed.org/app/uploads/sites/35/2023/09/2050.jpg",
"width": 1920,
"height": 1080
},
"large": {
"file": "https://ww2.kqed.org/app/uploads/sites/35/2023/09/2050-1020x574.jpg",
"width": 1020,
"mimeType": "image/jpeg",
"height": 574
},
"1536x1536": {
"file": "https://ww2.kqed.org/app/uploads/sites/35/2023/09/2050-1536x864.jpg",
"width": 1536,
"mimeType": "image/jpeg",
"height": 864
},
"medium": {
"file": "https://ww2.kqed.org/app/uploads/sites/35/2023/09/2050-800x450.jpg",
"width": 800,
"mimeType": "image/jpeg",
"height": 450
},
"medium_large": {
"file": "https://ww2.kqed.org/app/uploads/sites/35/2023/09/2050-768x432.jpg",
"width": 768,
"mimeType": "image/jpeg",
"height": 432
}
},
"publishDate": 1695498022,
"modified": 1695498022,
"caption": null,
"description": null,
"title": "2050",
"credit": null,
"status": "inherit",
"altTag": null,
"isLoading": false,
"fetchFailed": false
},
"science_1966628": {
"type": "attachments",
"id": "science_1966628",
"meta": {
"index": "attachments_1716263798",
"site": "science",
"id": "1966628",
"found": true
},
"parent": 1966305,
"imgSizes": {
"twentyfourteen-full-width": {
"file": "https://ww2.kqed.org/app/uploads/sites/35/2020/06/quiz-again-1038x576.jpg",
"width": 1038,
"mimeType": "image/jpeg",
"height": 576
},
"thumbnail": {
"file": "https://ww2.kqed.org/app/uploads/sites/35/2020/06/quiz-again-160x90.jpg",
"width": 160,
"mimeType": "image/jpeg",
"height": 90
},
"post-thumbnail": {
"file": "https://ww2.kqed.org/app/uploads/sites/35/2020/06/quiz-again-672x372.jpg",
"width": 672,
"mimeType": "image/jpeg",
"height": 372
},
"kqedFullSize": {
"file": "https://ww2.kqed.org/app/uploads/sites/35/2020/06/quiz-again.jpg",
"width": 1920,
"height": 1080
},
"large": {
"file": "https://ww2.kqed.org/app/uploads/sites/35/2020/06/quiz-again-1020x574.jpg",
"width": 1020,
"mimeType": "image/jpeg",
"height": 574
},
"1536x1536": {
"file": "https://ww2.kqed.org/app/uploads/sites/35/2020/06/quiz-again-1536x864.jpg",
"width": 1536,
"mimeType": "image/jpeg",
"height": 864
},
"medium": {
"file": "https://ww2.kqed.org/app/uploads/sites/35/2020/06/quiz-again-800x450.jpg",
"width": 800,
"mimeType": "image/jpeg",
"height": 450
},
"medium_large": {
"file": "https://ww2.kqed.org/app/uploads/sites/35/2020/06/quiz-again-768x432.jpg",
"width": 768,
"mimeType": "image/jpeg",
"height": 432
}
},
"publishDate": 1593547567,
"modified": 1593547589,
"caption": null,
"description": null,
"title": "quiz-again",
"credit": "Jasmine Garnett/KQED",
"status": "inherit",
"isLoading": false,
"fetchFailed": false
},
"science_1972037": {
"type": "attachments",
"id": "science_1972037",
"meta": {
"index": "attachments_1716263798",
"site": "science",
"id": "1972037",
"found": true
},
"parent": 0,
"imgSizes": {
"twentyfourteen-full-width": {
"file": "https://ww2.kqed.org/app/uploads/sites/35/2021/01/KQEDScience_Charts_210103_FI-1038x576.jpg",
"width": 1038,
"mimeType": "image/jpeg",
"height": 576
},
"thumbnail": {
"file": "https://ww2.kqed.org/app/uploads/sites/35/2021/01/KQEDScience_Charts_210103_FI-160x90.jpg",
"width": 160,
"mimeType": "image/jpeg",
"height": 90
},
"post-thumbnail": {
"file": "https://ww2.kqed.org/app/uploads/sites/35/2021/01/KQEDScience_Charts_210103_FI-672x372.jpg",
"width": 672,
"mimeType": "image/jpeg",
"height": 372
},
"kqedFullSize": {
"file": "https://ww2.kqed.org/app/uploads/sites/35/2021/01/KQEDScience_Charts_210103_FI.jpg",
"width": 1920,
"height": 1080
},
"large": {
"file": "https://ww2.kqed.org/app/uploads/sites/35/2021/01/KQEDScience_Charts_210103_FI-1020x574.jpg",
"width": 1020,
"mimeType": "image/jpeg",
"height": 574
},
"1536x1536": {
"file": "https://ww2.kqed.org/app/uploads/sites/35/2021/01/KQEDScience_Charts_210103_FI-1536x864.jpg",
"width": 1536,
"mimeType": "image/jpeg",
"height": 864
},
"medium": {
"file": "https://ww2.kqed.org/app/uploads/sites/35/2021/01/KQEDScience_Charts_210103_FI-800x450.jpg",
"width": 800,
"mimeType": "image/jpeg",
"height": 450
},
"medium_large": {
"file": "https://ww2.kqed.org/app/uploads/sites/35/2021/01/KQEDScience_Charts_210103_FI-768x432.jpg",
"width": 768,
"mimeType": "image/jpeg",
"height": 432
}
},
"publishDate": 1609782893,
"modified": 1609782893,
"caption": null,
"description": null,
"title": "KQEDScience_Charts_210103_FI",
"credit": null,
"status": "inherit",
"altTag": null,
"isLoading": false,
"fetchFailed": false
},
"science_1965448": {
"type": "attachments",
"id": "science_1965448",
"meta": {
"index": "attachments_1716263798",
"site": "science",
"id": "1965448",
"found": true
},
"parent": 1965221,
"imgSizes": {
"twentyfourteen-full-width": {
"file": "https://ww2.kqed.org/app/uploads/sites/35/2020/06/KQEDScience_NursingOutbreak_FI-1038x576.jpg",
"width": 1038,
"mimeType": "image/jpeg",
"height": 576
},
"thumbnail": {
"file": "https://ww2.kqed.org/app/uploads/sites/35/2020/06/KQEDScience_NursingOutbreak_FI-160x90.jpg",
"width": 160,
"mimeType": "image/jpeg",
"height": 90
},
"post-thumbnail": {
"file": "https://ww2.kqed.org/app/uploads/sites/35/2020/06/KQEDScience_NursingOutbreak_FI-672x372.jpg",
"width": 672,
"mimeType": "image/jpeg",
"height": 372
},
"kqedFullSize": {
"file": "https://ww2.kqed.org/app/uploads/sites/35/2020/06/KQEDScience_NursingOutbreak_FI.jpg",
"width": 1920,
"height": 1080
},
"large": {
"file": "https://ww2.kqed.org/app/uploads/sites/35/2020/06/KQEDScience_NursingOutbreak_FI-1020x574.jpg",
"width": 1020,
"mimeType": "image/jpeg",
"height": 574
},
"full-width": {
"file": "https://ww2.kqed.org/app/uploads/sites/35/2020/06/KQEDScience_NursingOutbreak_FI-1920x1080.jpg",
"width": 1920,
"mimeType": "image/jpeg",
"height": 1080
},
"medium": {
"file": "https://ww2.kqed.org/app/uploads/sites/35/2020/06/KQEDScience_NursingOutbreak_FI-800x450.jpg",
"width": 800,
"mimeType": "image/jpeg",
"height": 450
},
"medium_large": {
"file": "https://ww2.kqed.org/app/uploads/sites/35/2020/06/KQEDScience_NursingOutbreak_FI-768x432.jpg",
"width": 768,
"mimeType": "image/jpeg",
"height": 432
}
},
"publishDate": 1591213939,
"modified": 1591213939,
"caption": null,
"description": null,
"title": "KQEDScience_NursingOutbreak_FI",
"credit": null,
"status": "inherit",
"isLoading": false,
"fetchFailed": false
},
"science_1964095": {
"type": "attachments",
"id": "science_1964095",
"meta": {
"index": "attachments_1716263798",
"site": "science",
"id": "1964095",
"found": true
},
"parent": 1964094,
"imgSizes": {
"twentyfourteen-full-width": {
"file": "https://ww2.kqed.org/app/uploads/sites/35/2020/05/RS43166_GettyImages-1206847094-qut-1038x576.jpg",
"width": 1038,
"mimeType": "image/jpeg",
"height": 576
},
"thumbnail": {
"file": "https://ww2.kqed.org/app/uploads/sites/35/2020/05/RS43166_GettyImages-1206847094-qut-160x98.jpg",
"width": 160,
"mimeType": "image/jpeg",
"height": 98
},
"post-thumbnail": {
"file": "https://ww2.kqed.org/app/uploads/sites/35/2020/05/RS43166_GettyImages-1206847094-qut-672x372.jpg",
"width": 672,
"mimeType": "image/jpeg",
"height": 372
},
"kqedFullSize": {
"file": "https://ww2.kqed.org/app/uploads/sites/35/2020/05/RS43166_GettyImages-1206847094-qut.jpg",
"width": 1920,
"height": 1173
},
"large": {
"file": "https://ww2.kqed.org/app/uploads/sites/35/2020/05/RS43166_GettyImages-1206847094-qut-1020x623.jpg",
"width": 1020,
"mimeType": "image/jpeg",
"height": 623
},
"full-width": {
"file": "https://ww2.kqed.org/app/uploads/sites/35/2020/05/RS43166_GettyImages-1206847094-qut-1920x1173.jpg",
"width": 1920,
"mimeType": "image/jpeg",
"height": 1173
},
"medium": {
"file": "https://ww2.kqed.org/app/uploads/sites/35/2020/05/RS43166_GettyImages-1206847094-qut-800x489.jpg",
"width": 800,
"mimeType": "image/jpeg",
"height": 489
},
"medium_large": {
"file": "https://ww2.kqed.org/app/uploads/sites/35/2020/05/RS43166_GettyImages-1206847094-qut-768x469.jpg",
"width": 768,
"mimeType": "image/jpeg",
"height": 469
}
},
"publishDate": 1589315872,
"modified": 1589315952,
"caption": "Medical workers at Kaiser Permanente French Campus test a patient for the novel coronavirus on March 12, 2020. ",
"description": null,
"title": "RS43166_GettyImages-1206847094-qut",
"credit": "JOSH EDELSON/AFP via Getty Images",
"status": "inherit",
"isLoading": false,
"fetchFailed": false
}
},
"audioPlayerReducer": {
"postId": "stream_live",
"isPaused": true,
"isPlaying": false,
"pfsActive": false,
"pledgeModalIsOpen": true,
"playerDrawerIsOpen": false,
"liveAudioPlayStartedAt": 0,
"liveAudioPlayContext": ""
},
"authorsReducer": {
"thailye": {
"type": "authors",
"id": "11501",
"meta": {
"index": "authors_1716337520",
"id": "11501",
"found": true
},
"name": "Teodros Hailye",
"firstName": "Teodros",
"lastName": "Hailye",
"slug": "thailye",
"email": "thailye@KQED.org",
"display_author_email": false,
"staff_mastheads": [],
"title": "Information Designer",
"bio": null,
"avatar": "https://secure.gravatar.com/avatar/bfb755f5a66ebaccd414e310b7d7c94a?s=600&d=blank&r=g",
"twitter": null,
"facebook": null,
"instagram": null,
"linkedin": null,
"sites": [
{
"site": "science",
"roles": []
}
],
"headData": {
"title": "Teodros Hailye | KQED",
"description": "Information Designer",
"ogImgSrc": "https://secure.gravatar.com/avatar/bfb755f5a66ebaccd414e310b7d7c94a?s=600&d=blank&r=g",
"twImgSrc": "https://secure.gravatar.com/avatar/bfb755f5a66ebaccd414e310b7d7c94a?s=600&d=blank&r=g"
},
"isLoading": false,
"link": "/author/thailye"
},
"jbrooks": {
"type": "authors",
"id": "80",
"meta": {
"index": "authors_1716337520",
"id": "80",
"found": true
},
"name": "Jon Brooks",
"firstName": "Jon",
"lastName": "Brooks",
"slug": "jbrooks",
"email": "jbrooks@kqed.org",
"display_author_email": true,
"staff_mastheads": [
"science"
],
"title": "Digital Editor",
"bio": "Jon Brooks is a former Digital Editor for KQED Science. He is the former editor of KQED’s daily news blog, News Fix. In 2014, he won a California Journalism Award for his coverage of ride services like Uber and Lyft and the taxi industry. A veteran blogger, he previously worked for Yahoo! in various news writing and editing roles. Jon is also a playwright whose work has been produced in San Francisco, New York, Italy, and around the U.S. He has written about film for his own blog and studied film at Boston University.",
"avatar": "https://secure.gravatar.com/avatar/98887f7ed1c876ed414d4c915e969584?s=600&d=blank&r=g",
"twitter": "jbrooksfoy",
"facebook": null,
"instagram": null,
"linkedin": null,
"sites": [
{
"site": "arts",
"roles": [
"Contributor",
"editor"
]
},
{
"site": "news",
"roles": [
"author"
]
},
{
"site": "futureofyou",
"roles": [
"administrator"
]
},
{
"site": "mindshift",
"roles": [
"editor"
]
},
{
"site": "stateofhealth",
"roles": [
"editor"
]
},
{
"site": "science",
"roles": [
"administrator"
]
},
{
"site": "quest",
"roles": [
"editor"
]
}
],
"headData": {
"title": "Jon Brooks | KQED",
"description": "Digital Editor",
"ogImgSrc": "https://secure.gravatar.com/avatar/98887f7ed1c876ed414d4c915e969584?s=600&d=blank&r=g",
"twImgSrc": "https://secure.gravatar.com/avatar/98887f7ed1c876ed414d4c915e969584?s=600&d=blank&r=g"
},
"isLoading": false,
"link": "/author/jbrooks"
},
"lisapickoffwhite-2": {
"type": "authors",
"id": "199",
"meta": {
"index": "authors_1716337520",
"id": "199",
"found": true
},
"name": "Lisa Pickoff-White",
"firstName": "Lisa",
"lastName": "Pickoff-White",
"slug": "lisapickoffwhite-2",
"email": "lpickoffwhite@kqed.org",
"display_author_email": false,
"staff_mastheads": [
"news"
],
"title": "Data Journalist, Senior Producer",
"bio": "Lisa Pickoff-White is KQED's data reporter. Lisa specializes in simplifying complex topics and bringing them to life through compelling visuals, including photography and data visualizations. She previously has worked at the Center for Investigative Reporting and other national outlets. Her work has been honored with awards from the Online News Association, Investigative Reporters and Editors, the Society of Professional Journalists and SXSW Interactive. \u003cstrong> \u003c/strong>",
"avatar": "https://secure.gravatar.com/avatar/5513c5f3967df792aa65bee2501e84d6?s=600&d=blank&r=g",
"twitter": "pickoffwhite",
"facebook": null,
"instagram": null,
"linkedin": null,
"sites": [
{
"site": "",
"roles": [
"editor"
]
},
{
"site": "arts",
"roles": []
},
{
"site": "news",
"roles": [
"administrator"
]
},
{
"site": "about",
"roles": [
"editor"
]
},
{
"site": "stateofhealth",
"roles": [
"administrator"
]
},
{
"site": "science",
"roles": [
"editor"
]
},
{
"site": "quest",
"roles": [
"editor"
]
},
{
"site": "forum",
"roles": [
"editor"
]
}
],
"headData": {
"title": "Lisa Pickoff-White | KQED",
"description": "Data Journalist, Senior Producer",
"ogImgSrc": "https://secure.gravatar.com/avatar/5513c5f3967df792aa65bee2501e84d6?s=600&d=blank&r=g",
"twImgSrc": "https://secure.gravatar.com/avatar/5513c5f3967df792aa65bee2501e84d6?s=600&d=blank&r=g"
},
"isLoading": false,
"link": "/author/lisapickoffwhite-2"
},
"mpeterson": {
"type": "authors",
"id": "11223",
"meta": {
"index": "authors_1716337520",
"id": "11223",
"found": true
},
"name": "Molly Peterson",
"firstName": "Molly",
"lastName": "Peterson",
"slug": "mpeterson",
"email": "mpeterson@kqed.org",
"display_author_email": false,
"staff_mastheads": [],
"title": null,
"bio": "Molly Peterson reports for KQED science and news on climate change, catastrophe and risk. Previously she was environment correspondent at Southern California Public Radio. Her work has also appeared at The New York Times, The Guardian, on NPR, at High Country News, on Code Switch, and other national outlets. She has been honored with awards from Public Radio News Directors Incorporated, Investigative Reporters and Editors, the Society for Professional Journalists, the Los Angeles Press Club, and RTNDA Edward R. Murrow awards, among others.",
"avatar": "https://secure.gravatar.com/avatar/7908e2807131f776cc8165c649530b05?s=600&d=blank&r=g",
"twitter": "Mollydacious",
"facebook": null,
"instagram": "https://www.instagram.com/radiomolly/",
"linkedin": null,
"sites": [
{
"site": "news",
"roles": [
"subscriber"
]
},
{
"site": "futureofyou",
"roles": [
"editor"
]
},
{
"site": "science",
"roles": [
"editor"
]
}
],
"headData": {
"title": "Molly Peterson | KQED",
"description": null,
"ogImgSrc": "https://secure.gravatar.com/avatar/7908e2807131f776cc8165c649530b05?s=600&d=blank&r=g",
"twImgSrc": "https://secure.gravatar.com/avatar/7908e2807131f776cc8165c649530b05?s=600&d=blank&r=g"
},
"isLoading": false,
"link": "/author/mpeterson"
},
"parcuni": {
"type": "authors",
"id": "11368",
"meta": {
"index": "authors_1716337520",
"id": "11368",
"found": true
},
"name": "Peter Arcuni",
"firstName": "Peter",
"lastName": "Arcuni",
"slug": "parcuni",
"email": "parcuni@KQED.org",
"display_author_email": false,
"staff_mastheads": [
"science"
],
"title": "Reporter",
"bio": "Peter reports radio and online stories for \u003cem>KQED Science\u003c/em>. His work has also appeared on the \u003cem>The California Report\u003c/em> morning show and \u003cem>KQED News\u003c/em>. His production credits include \u003cem>The California Report, The California Report Magazine\u003c/em> and KQED's local news podcast \u003cem>The Bay\u003c/em>. Other credits include NPR's \u003cem>All Things Considered\u003c/em>, WNYC's \u003cem>Science Friday\u003c/em>, WBUR's \u003cem>Here & Now\u003c/em>, WIRED and SFGate. Peter graduated from Brown University and earned a master's degree in journalism from Stanford. He's covered everything from homelessness to wildfires, health, the environment, arts and Thanksgiving in San Quentin prison. In other lives, he played rock n roll music and studied neuroscience. You can email him at: parcuni@kqed.org",
"avatar": "https://secure.gravatar.com/avatar/d5032f6f27199d478af34ad2e1d98732?s=600&d=blank&r=g",
"twitter": "peterarcuni",
"facebook": null,
"instagram": null,
"linkedin": null,
"sites": [
{
"site": "news",
"roles": [
"editor"
]
},
{
"site": "science",
"roles": [
"editor"
]
}
],
"headData": {
"title": "Peter Arcuni | KQED",
"description": "Reporter",
"ogImgSrc": "https://secure.gravatar.com/avatar/d5032f6f27199d478af34ad2e1d98732?s=600&d=blank&r=g",
"twImgSrc": "https://secure.gravatar.com/avatar/d5032f6f27199d478af34ad2e1d98732?s=600&d=blank&r=g"
},
"isLoading": false,
"link": "/author/parcuni"
},
"kevinstark": {
"type": "authors",
"id": "11608",
"meta": {
"index": "authors_1716337520",
"id": "11608",
"found": true
},
"name": "Kevin Stark",
"firstName": "Kevin",
"lastName": "Stark",
"slug": "kevinstark",
"email": "kstark@kqed.org",
"display_author_email": true,
"staff_mastheads": [
"science"
],
"title": "Senior Editor",
"bio": "Kevin is a senior editor for KQED Science, managing the station's health and climate desks. His journalism career began in the Pacific Northwest, and he later became a lead reporter for the San Francisco Public Press. His work has appeared in Pacific Standard magazine, the Energy News Network, the Center for Investigative Reporting's Reveal and WBEZ in Chicago. Kevin joined KQED in 2019, and has covered issues related to energy, wildfire, climate change and the environment.",
"avatar": "https://secure.gravatar.com/avatar/1f646bf546a63d638e04ff23b52b0e79?s=600&d=blank&r=g",
"twitter": "starkkev",
"facebook": null,
"instagram": null,
"linkedin": null,
"sites": [
{
"site": "",
"roles": [
"editor"
]
},
{
"site": "news",
"roles": [
"editor"
]
},
{
"site": "science",
"roles": [
"administrator"
]
}
],
"headData": {
"title": "Kevin Stark | KQED",
"description": "Senior Editor",
"ogImgSrc": "https://secure.gravatar.com/avatar/1f646bf546a63d638e04ff23b52b0e79?s=600&d=blank&r=g",
"twImgSrc": "https://secure.gravatar.com/avatar/1f646bf546a63d638e04ff23b52b0e79?s=600&d=blank&r=g"
},
"isLoading": false,
"link": "/author/kevinstark"
},
"aremmel": {
"type": "authors",
"id": "11653",
"meta": {
"index": "authors_1716337520",
"id": "11653",
"found": true
},
"name": "Ariana Remmel",
"firstName": "Ariana",
"lastName": "Remmel",
"slug": "aremmel",
"email": "aremmel@kqed.org",
"display_author_email": false,
"staff_mastheads": [],
"title": null,
"bio": null,
"avatar": "https://secure.gravatar.com/avatar/88d31419d97c3f81993d2d8db8608039?s=600&d=blank&r=g",
"twitter": null,
"facebook": null,
"instagram": null,
"linkedin": null,
"sites": [
{
"site": "science",
"roles": [
"editor"
]
}
],
"headData": {
"title": "Ariana Remmel | KQED",
"description": null,
"ogImgSrc": "https://secure.gravatar.com/avatar/88d31419d97c3f81993d2d8db8608039?s=600&d=blank&r=g",
"twImgSrc": "https://secure.gravatar.com/avatar/88d31419d97c3f81993d2d8db8608039?s=600&d=blank&r=g"
},
"isLoading": false,
"link": "/author/aremmel"
},
"eromero": {
"type": "authors",
"id": "11746",
"meta": {
"index": "authors_1716337520",
"id": "11746",
"found": true
},
"name": "Ezra David Romero",
"firstName": "Ezra David",
"lastName": "Romero",
"slug": "eromero",
"email": "eromero@kqed.org",
"display_author_email": true,
"staff_mastheads": [
"news",
"science"
],
"title": "Climate Reporter",
"bio": "Ezra David Romero is a climate reporter for KQED News. He covers the absence and excess of water in the Bay Area — think sea level rise, flooding and drought. For nearly a decade he’s covered how warming temperatures are altering the lives of Californians. He’s reported on farmers worried their pistachio trees aren’t getting enough sleep, families desperate for water, scientists studying dying giant sequoias, and alongside firefighters containing wildfires. His work has appeared on local stations across California and nationally on public radio shows like Morning Edition, Here and Now, All Things Considered and Science Friday. ",
"avatar": "https://secure.gravatar.com/avatar/9c15bb8bab267e058708a9eeaeef16bf?s=600&d=blank&r=g",
"twitter": "ezraromero",
"bluesky": null,
"facebook": null,
"instagram": null,
"linkedin": null,
"sites": [
{
"site": "arts",
"roles": [
"editor"
]
},
{
"site": "news",
"roles": [
"editor"
]
},
{
"site": "science",
"roles": [
"editor"
]
},
{
"site": "liveblog",
"roles": [
"author"
]
}
],
"headData": {
"title": "Ezra David Romero | KQED",
"description": "Climate Reporter",
"ogImgSrc": "https://secure.gravatar.com/avatar/9c15bb8bab267e058708a9eeaeef16bf?s=600&d=blank&r=g",
"twImgSrc": "https://secure.gravatar.com/avatar/9c15bb8bab267e058708a9eeaeef16bf?s=600&d=blank&r=g"
},
"isLoading": false,
"link": "/author/eromero"
}
},
"pagesReducer": {
"author_thailye": {
"type": "pages",
"id": "11501",
"meta": {
"index": "authors_1716337520",
"id": "11501",
"score": 6.421297,
"site": "authors"
},
"name": "Teodros Hailye",
"firstName": "Teodros",
"lastName": "Hailye",
"slug": "thailye",
"email": "thailye@KQED.org",
"display_author_email": false,
"staff_mastheads": [],
"title": "Information Designer",
"bio": null,
"avatar": "https://secure.gravatar.com/avatar/bfb755f5a66ebaccd414e310b7d7c94a?s=600&d=blank&r=g",
"twitter": null,
"facebook": null,
"instagram": null,
"linkedin": null,
"sites": [
{
"site": "science",
"roles": []
}
],
"headData": {},
"isLoading": false,
"hasAllInfo": true,
"blocks": [
{
"blockName": "kqed/staff-member",
"attrs": {
"author": {
"type": "authors",
"id": "11501",
"meta": {
"index": "authors_1716337520",
"id": "11501",
"score": 6.421297
},
"name": "Teodros Hailye",
"firstName": "Teodros",
"lastName": "Hailye",
"slug": "thailye",
"email": "thailye@KQED.org",
"display_author_email": false,
"staff_mastheads": "[Circular]",
"title": "Information Designer",
"bio": null,
"avatar": "https://secure.gravatar.com/avatar/bfb755f5a66ebaccd414e310b7d7c94a?s=600&d=blank&r=g",
"twitter": null,
"facebook": null,
"instagram": null,
"linkedin": null,
"sites": "[Circular]",
"headData": {
"title": "Teodros Hailye | KQED",
"description": "Information Designer",
"ogImgSrc": "https://secure.gravatar.com/avatar/bfb755f5a66ebaccd414e310b7d7c94a?s=600&d=blank&r=g",
"twImgSrc": "https://secure.gravatar.com/avatar/bfb755f5a66ebaccd414e310b7d7c94a?s=600&d=blank&r=g"
},
"isLoading": false,
"link": "/author/thailye",
"hasAllInfo": true
}
}
},
{
"blockName": "kqed/post-list",
"attrs": {
"query": "posts?author=11501&authorName=Teodros Hailye",
"title": "By Teodros Hailye",
"layout": "cardArticle2",
"className": "wp-block--nomargintop",
"seeMore": true
}
}
]
}
},
"pfsSessionReducer": {},
"postsReducer": {
"stream_live": {
"type": "live",
"id": "stream_live",
"audioUrl": "https://streams.kqed.org/kqedradio",
"title": "Live Stream",
"excerpt": "Live Stream information currently unavailable.",
"link": "/radio",
"featImg": "",
"label": {
"name": "KQED Live",
"link": "/"
}
},
"stream_kqedNewscast": {
"type": "posts",
"id": "stream_kqedNewscast",
"audioUrl": "https://www.kqed.org/.stream/anon/radio/RDnews/newscast.mp3?_=1",
"title": "KQED Newscast",
"featImg": "",
"label": {
"name": "88.5 FM",
"link": "/"
}
},
"science_1979645": {
"type": "posts",
"id": "science_1979645",
"meta": {
"index": "posts_1716263798",
"site": "science",
"id": "1979645",
"score": null,
"sort": [
1657004488000
]
},
"parent": 0,
"labelTerm": {},
"blocks": [],
"publishDate": 1657004488,
"format": "aside",
"title": "See a Map of Bay Area Hazardous Sites at Risk From Rising Seas",
"headTitle": "See a Map of Bay Area Hazardous Sites at Risk From Rising Seas | KQED",
"content": "\u003ch5>Bay Area Hazardous Sites and 2100 Sea Level Rise\u003c/h5>\n\u003cp style=\"line-height: 90%\">\u003cspan style=\"font-size: small\">\u003cem>Click the arrow to view the map legend. Use your mouse to move the map. Use the + and – signs to zoom in and out. Click on the dots to view details. Click on the magnifying glass to search for a specific address. Areas marked by circles show the impact of rising seas and groundwater together, while squares show groundwater impacts only. Sources: Climate Central, UCLA, UC Berkeley, USGS\u003c/em>\u003c/span>\u003cbr>\n\u003c!-- iframe plugin v.4.3 wordpress.org/plugins/iframe/ -->\u003cbr>\n\u003ciframe loading=\"lazy\" src=\"https://www.arcgis.com/apps/Embed/index.html?webmap=3e86f6c8e421434984af53fe450e9b3c&extent=-122.5783,37.3195,-121.8292,37.9367&home=true&zoom=true&scale=true&search=true&searchextent=false&details=true&legend=true&active_panel=legend&disable_scroll=true&theme=light\" width=\"100%\" height=\"500\" scrolling=\"yes\" class=\"iframe-class\" frameborder=\"0\">\u003c/iframe>\n\u003c/p>\n\u003cp>More than 900 hazardous sites — power plants, sewage treatment plants, refineries, cleanup areas and other facilities — across California could be inundated with ocean water and groundwater by the end of the century, according to climate scientists at UCLA and UC Berkeley.\u003c/p>\n\u003cp>“Climate change is presenting new risks that can lead to excess releases of hazardous materials from these highly industrialized parts of our coastline,” said UCLA’s Lara Cushing. “Our analysis also shows that communities of color are much more likely to live near one of these risk sites, as are lower-income communities.”\u003c/p>\n\u003cp>Cushing and UC Berkeley’s Rachel Morello-Frosch, both environmental health scientists, last year launched an interactive tool, \u003ca href=\"https://sites.google.com/berkeley.edu/toxictides/home?authuser=0\">Toxic Tides\u003c/a>, mapping California’s hazardous sites that could be inundated by sea level rise.\u003c/p>\n\u003cp>The first iteration of the project looked at middle-of-the-line climate scenarios based on models used by the\u003ca href=\"https://www.ipcc.ch/srocc/chapter/chapter-4-sea-level-rise-and-implications-for-low-lying-islands-coasts-and-communities/\"> Intergovernmental Panel on Climate Change\u003c/a>.\u003c/p>\n\u003cp>[ad fullwidth]\u003c/p>\n\u003cp>After hearing feedback from shoreline residents and local officials in a series of virtual community workshops that the work was informative but didn’t estimate the riskiest scenarios, \u003ca href=\"http://www.opc.ca.gov/webmaster/ftp/pdf/agenda_items/20180314/Item3_Exhibit-A_OPC_SLR_Guidance-rd3.pdf\">the scientists have updated their project with a more extreme scenario\u003c/a> in which ice sheets in \u003ca href=\"https://www.nationalgeographic.com/environment/article/antarctic-ice-shelves-are-shattering-how-fast-will-seas-rise\">West Antarctica collapse\u003c/a>.\u003c/p>\n\u003cp>If this occurs, San Francisco Bay could rise by 10.1 feet by 2100.\u003c/p>\n\u003cp>Differences in scientific modeling scenarios before the year 2050 are minor, but they diverge significantly after mid-century. The results depend on greenhouse gas emissions, which human beings will determine by the rate they burn fossil fuels.\u003c/p>\n\u003cp>“It was important to consider the worst-case scenario because, unfortunately, our leaders, especially at the federal level, have not risen to the challenge of addressing climate change,” said Cushing.\u003c/p>\n\u003cp>The researchers also used federal groundwater data to examine how rising ocean water would drive freshwater up from the ground.\u003c/p>\n\u003cp>The research highlights the Hunters Point Naval Shipyard and a cluster of other hazardous sites in the San Francisco neighborhood of Bayview-Hunters Point. And dozens of power plants, refineries, landfills and other industrial sites line communities like East Palo Alto, Richmond, Oakland and San Jose.\u003c/p>\n\u003cp>“[Sea level rise] can enhance the risk of groundwater encroachment, particularly in sites where there are toxic contaminants in the soil, or even in the groundwater,” said Morello-Frosch.\u003c/p>\n\u003cp>This is especially important to understand, she said, for places where toxic contamination is in \u003ca href=\"https://www.epa.gov/sites/default/files/2015-04/documents/a_citizens_guide_to_capping.pdf\">soil with a cap — often made of concrete, clay or strong plastic-like materials\u003c/a> — holding it in place to protect the public and the environment. The problem with these caps: Rising groundwater from below could eat away at the pollution, spread it to other areas or bring that contaminated water aboveground, exposing people and San Francisco Bay itself.\u003c/p>\n\u003cp>The scientist’s findings showcase significant risk. But they note that understanding the effect of sea level rise and groundwater encroachment on each hazardous facility will take site-specific data. This could include the level of contamination, the depth of groundwater, any existing caps, or sea walls and other protective measures.\u003c/p>\n\u003cp>“It’s important to develop these tools because you want to get all of this data together in one place,” Morello-Frosch said. “There needs to be some coordinated effort to begin to respond.”\u003c/p>\n\u003ch3>Data sources\u003c/h3>\n\u003cp>The Toxic Tides team provided KQED with \u003ca href=\"https://sites.google.com/berkeley.edu/toxictides/extreme-scenarios?authuser=0\">the map’s data layers\u003c/a>, which feature the high-risk aversion scenario for sea level rise as described in \u003ca href=\"http://www.opc.ca.gov/webmaster/ftp/pdf/agenda_items/20180314/Item3_Exhibit-A_OPC_SLR_Guidance-rd3.pdf\">the latest state guidance\u003c/a>.\u003c/p>\n\u003cp>\u003ca href=\"https://www.sciencebase.gov/catalog/item/5bd9f318e4b0b3fc5cec20ed\">Groundwater data\u003c/a> originates from the U.S. Geological Survey. The data layer shows 3 meters (9.8 feet), which corresponds most closely to the degree of sea level rise for the high-risk aversion scenario.\u003c/p>\n\u003cp>Flood risk projections are based on rising sea levels, tides and storm surge. Site-specific details about groundwater contamination are not included in these findings. Scientists derived hazardous site data from federal databases that track landfills, toxic cleanup sites, refineries, sewage treatment plants and other sites.\u003c/p>\n\u003cp>The databases include the U.S. EPA Facility Registry Service, the U.S. Energy Information Administration’s U.S. Energy Atlas, the U.S. Army Corps of Engineers’ Waterborne Commerce Statistics Center, and the Enverus database of oil and gas well permits. The authors say “a lack of groundwater data coupled with imprecise estimates of facility boundaries may lead to potential underestimates of the number of at-risk facilities.”\u003c/p>\n\u003cp>\u003c/p>\n\u003cp>The findings do not include an exhaustive list of all potentially contaminated sites, like underground storage tanks or other industrial sites with contamination. Find more information on the San Francisco Bay Conservation and Development Commission’s \u003ca href=\"https://explorer.adaptingtorisingtides.org/home\"> Bay Shoreline Flood Explorer \u003c/a> or the San Francisco Baykeeper \u003ca href=\"https://baykeeper.org/shoreview/pollution.html\"> Sea Level Rise and Pollution Risk to the Bay \u003c/a> website.\u003c/p>\n\n",
"stats": {
"hasVideo": false,
"hasChartOrMap": true,
"hasAudio": false,
"hasPolis": false,
"wordCount": 879,
"hasGoogleForm": false,
"hasGallery": false,
"hasHearkenModule": false,
"iframeSrcs": [
"https://www.arcgis.com/apps/Embed/index.html"
],
"paragraphCount": 21
},
"modified": 1704846235,
"excerpt": "Hundreds of refineries, cleanup areas and other hazardous sites across California could be inundated with ocean water and groundwater by the end of the century.",
"headData": {
"twImgId": "",
"twTitle": "",
"ogTitle": "",
"ogImgId": "",
"twDescription": "",
"description": "Hundreds of refineries, cleanup areas and other hazardous sites across California could be inundated with ocean water and groundwater by the end of the century.",
"title": "See a Map of Bay Area Hazardous Sites at Risk From Rising Seas | KQED",
"ogDescription": "",
"schema": {
"@context": "https://schema.org",
"@type": "Article",
"headline": "See a Map of Bay Area Hazardous Sites at Risk From Rising Seas",
"datePublished": "2022-07-05T00:01:28-07:00",
"dateModified": "2024-01-09T16:23:55-08:00",
"image": "https://cdn.kqed.org/wp-content/uploads/2020/02/KQED-OG-Image@1x.png"
}
},
"guestAuthors": [],
"slug": "see-a-map-of-hazardous-sites-at-risk-from-rising-seas",
"status": "publish",
"excludeFromSiteSearch": "Include",
"sticky": false,
"source": "Climate Change",
"articleAge": "0",
"path": "/science/1979645/see-a-map-of-hazardous-sites-at-risk-from-rising-seas",
"audioTrackLength": null,
"parsedContent": [
{
"type": "contentString",
"content": "\u003cdiv class=\"post-body\">\u003cp>\u003ch5>Bay Area Hazardous Sites and 2100 Sea Level Rise\u003c/h5>\n\u003cp style=\"line-height: 90%\">\u003cspan style=\"font-size: small\">\u003cem>Click the arrow to view the map legend. Use your mouse to move the map. Use the + and – signs to zoom in and out. Click on the dots to view details. Click on the magnifying glass to search for a specific address. Areas marked by circles show the impact of rising seas and groundwater together, while squares show groundwater impacts only. Sources: Climate Central, UCLA, UC Berkeley, USGS\u003c/em>\u003c/span>\u003cbr>\n\u003c!-- iframe plugin v.4.3 wordpress.org/plugins/iframe/ -->\u003cbr>\n\u003ciframe loading=\"lazy\" src=\"https://www.arcgis.com/apps/Embed/index.html?webmap=3e86f6c8e421434984af53fe450e9b3c&extent=-122.5783,37.3195,-121.8292,37.9367&home=true&zoom=true&scale=true&search=true&searchextent=false&details=true&legend=true&active_panel=legend&disable_scroll=true&theme=light\" width=\"100%\" height=\"500\" scrolling=\"yes\" class=\"iframe-class\" frameborder=\"0\">\u003c/iframe>\n\u003c/p>\n\u003cp>More than 900 hazardous sites — power plants, sewage treatment plants, refineries, cleanup areas and other facilities — across California could be inundated with ocean water and groundwater by the end of the century, according to climate scientists at UCLA and UC Berkeley.\u003c/p>\n\u003cp>“Climate change is presenting new risks that can lead to excess releases of hazardous materials from these highly industrialized parts of our coastline,” said UCLA’s Lara Cushing. “Our analysis also shows that communities of color are much more likely to live near one of these risk sites, as are lower-income communities.”\u003c/p>\n\u003cp>Cushing and UC Berkeley’s Rachel Morello-Frosch, both environmental health scientists, last year launched an interactive tool, \u003ca href=\"https://sites.google.com/berkeley.edu/toxictides/home?authuser=0\">Toxic Tides\u003c/a>, mapping California’s hazardous sites that could be inundated by sea level rise.\u003c/p>\n\u003cp>The first iteration of the project looked at middle-of-the-line climate scenarios based on models used by the\u003ca href=\"https://www.ipcc.ch/srocc/chapter/chapter-4-sea-level-rise-and-implications-for-low-lying-islands-coasts-and-communities/\"> Intergovernmental Panel on Climate Change\u003c/a>.\u003c/p>\n\u003cp>\u003c/p>\u003c/div>",
"attributes": {
"named": {},
"numeric": []
}
},
{
"type": "component",
"content": "",
"name": "ad",
"attributes": {
"named": {
"label": "fullwidth"
},
"numeric": [
"fullwidth"
]
}
},
{
"type": "contentString",
"content": "\u003cdiv class=\"post-body\">\u003cp>\u003c/p>\n\u003cp>After hearing feedback from shoreline residents and local officials in a series of virtual community workshops that the work was informative but didn’t estimate the riskiest scenarios, \u003ca href=\"http://www.opc.ca.gov/webmaster/ftp/pdf/agenda_items/20180314/Item3_Exhibit-A_OPC_SLR_Guidance-rd3.pdf\">the scientists have updated their project with a more extreme scenario\u003c/a> in which ice sheets in \u003ca href=\"https://www.nationalgeographic.com/environment/article/antarctic-ice-shelves-are-shattering-how-fast-will-seas-rise\">West Antarctica collapse\u003c/a>.\u003c/p>\n\u003cp>If this occurs, San Francisco Bay could rise by 10.1 feet by 2100.\u003c/p>\n\u003cp>Differences in scientific modeling scenarios before the year 2050 are minor, but they diverge significantly after mid-century. The results depend on greenhouse gas emissions, which human beings will determine by the rate they burn fossil fuels.\u003c/p>\n\u003cp>“It was important to consider the worst-case scenario because, unfortunately, our leaders, especially at the federal level, have not risen to the challenge of addressing climate change,” said Cushing.\u003c/p>\n\u003cp>The researchers also used federal groundwater data to examine how rising ocean water would drive freshwater up from the ground.\u003c/p>\n\u003cp>The research highlights the Hunters Point Naval Shipyard and a cluster of other hazardous sites in the San Francisco neighborhood of Bayview-Hunters Point. And dozens of power plants, refineries, landfills and other industrial sites line communities like East Palo Alto, Richmond, Oakland and San Jose.\u003c/p>\n\u003cp>“[Sea level rise] can enhance the risk of groundwater encroachment, particularly in sites where there are toxic contaminants in the soil, or even in the groundwater,” said Morello-Frosch.\u003c/p>\n\u003cp>This is especially important to understand, she said, for places where toxic contamination is in \u003ca href=\"https://www.epa.gov/sites/default/files/2015-04/documents/a_citizens_guide_to_capping.pdf\">soil with a cap — often made of concrete, clay or strong plastic-like materials\u003c/a> — holding it in place to protect the public and the environment. The problem with these caps: Rising groundwater from below could eat away at the pollution, spread it to other areas or bring that contaminated water aboveground, exposing people and San Francisco Bay itself.\u003c/p>\n\u003cp>The scientist’s findings showcase significant risk. But they note that understanding the effect of sea level rise and groundwater encroachment on each hazardous facility will take site-specific data. This could include the level of contamination, the depth of groundwater, any existing caps, or sea walls and other protective measures.\u003c/p>\n\u003cp>“It’s important to develop these tools because you want to get all of this data together in one place,” Morello-Frosch said. “There needs to be some coordinated effort to begin to respond.”\u003c/p>\n\u003ch3>Data sources\u003c/h3>\n\u003cp>The Toxic Tides team provided KQED with \u003ca href=\"https://sites.google.com/berkeley.edu/toxictides/extreme-scenarios?authuser=0\">the map’s data layers\u003c/a>, which feature the high-risk aversion scenario for sea level rise as described in \u003ca href=\"http://www.opc.ca.gov/webmaster/ftp/pdf/agenda_items/20180314/Item3_Exhibit-A_OPC_SLR_Guidance-rd3.pdf\">the latest state guidance\u003c/a>.\u003c/p>\n\u003cp>\u003ca href=\"https://www.sciencebase.gov/catalog/item/5bd9f318e4b0b3fc5cec20ed\">Groundwater data\u003c/a> originates from the U.S. Geological Survey. The data layer shows 3 meters (9.8 feet), which corresponds most closely to the degree of sea level rise for the high-risk aversion scenario.\u003c/p>\n\u003cp>Flood risk projections are based on rising sea levels, tides and storm surge. Site-specific details about groundwater contamination are not included in these findings. Scientists derived hazardous site data from federal databases that track landfills, toxic cleanup sites, refineries, sewage treatment plants and other sites.\u003c/p>\n\u003cp>The databases include the U.S. EPA Facility Registry Service, the U.S. Energy Information Administration’s U.S. Energy Atlas, the U.S. Army Corps of Engineers’ Waterborne Commerce Statistics Center, and the Enverus database of oil and gas well permits. The authors say “a lack of groundwater data coupled with imprecise estimates of facility boundaries may lead to potential underestimates of the number of at-risk facilities.”\u003c/p>\n\u003cp>\u003c/p>\n\u003cp>The findings do not include an exhaustive list of all potentially contaminated sites, like underground storage tanks or other industrial sites with contamination. Find more information on the San Francisco Bay Conservation and Development Commission’s \u003ca href=\"https://explorer.adaptingtorisingtides.org/home\"> Bay Shoreline Flood Explorer \u003c/a> or the San Francisco Baykeeper \u003ca href=\"https://baykeeper.org/shoreview/pollution.html\"> Sea Level Rise and Pollution Risk to the Bay \u003c/a> website.\u003c/p>\n\n\u003c/div>\u003c/p>",
"attributes": {
"named": {},
"numeric": []
}
}
],
"link": "/science/1979645/see-a-map-of-hazardous-sites-at-risk-from-rising-seas",
"authors": [
"11746",
"11501"
],
"categories": [
"science_31",
"science_35",
"science_40",
"science_2873",
"science_4450"
],
"tags": [
"science_5178",
"science_194",
"science_4859",
"science_206"
],
"featImg": "science_1984388",
"label": "source_science_1979645"
},
"science_1975814": {
"type": "posts",
"id": "science_1975814",
"meta": {
"index": "posts_1716263798",
"site": "science",
"id": "1975814",
"score": null,
"sort": [
1626699604000
]
},
"parent": 0,
"labelTerm": {},
"blocks": [],
"publishDate": 1626699604,
"format": "standard",
"title": "A Harrowing California Fire Season is Here, Fueled by Historic Drought",
"headTitle": "A Harrowing California Fire Season is Here, Fueled by Historic Drought | KQED",
"content": "\u003cp>Two years of record dry winters and scorching early summer heat waves have primed forests across California to burn, just as the state heads into the hottest months of summer.\u003c/p>\n\u003cp>Fire season is here; fast, furious and early — exacerbated by dry conditions across most of the state, Paul Rogers, with the Mercury News, \u003ca href=\"https://www.mercurynews.com/2021/07/11/how-bad-is-this-fire-season-in-california-really-going-to-be/\">\u003cspan class=\"s1\">reported,\u003c/span>\u003c/a> writing that “memories of last year’s destructive fires are still fresh.”\u003c/p>\n\u003cp>“Remember, last year we saw the most acres burned in California as we’d ever seen in recorded history — 4.3 million acres burned,” Rogers said. “One out of every 24 acres of land in California burned last year. This year, like last year, it’s all about drought.”\u003c/p>\n\u003cp>And California is not alone, wildfires are ripping through forests, torching homes, and forcing evacuations \u003ca href=\"https://www.kqed.org/news/11881024/we-are-under-extreme-weather-conditions-wildfires-rage-from-california-to-alaska\">\u003cspan class=\"s1\">across the Western U.S.\u003c/span>\u003c/a> The largest wildfire of the year has incinerated an area more than twice the size of the city of Portland and is still burning in southwestern Oregon.\u003c/p>\n\u003cp>Rogers and KQED’s Raquel Maria Dillon spoke with Brian Watt, KQED’s morning news anchor, about how the drought is exacerbating the fire season.\u003c/p>\n\u003cfigure id=\"attachment_1975816\" class=\"wp-caption alignright\" style=\"max-width: 800px\">\u003cimg loading=\"lazy\" decoding=\"async\" class=\"size-medium wp-image-1975816\" src=\"https://ww2.kqed.org/app/uploads/sites/35/2021/07/BOOTLEG_OR_20210709-800x1422.jpg\" alt=\"\" width=\"800\" height=\"1422\" srcset=\"https://cdn.kqed.org/wp-content/uploads/sites/35/2021/07/BOOTLEG_OR_20210709-800x1422.jpg 800w, https://cdn.kqed.org/wp-content/uploads/sites/35/2021/07/BOOTLEG_OR_20210709-1020x1813.jpg 1020w, https://cdn.kqed.org/wp-content/uploads/sites/35/2021/07/BOOTLEG_OR_20210709-160x284.jpg 160w, https://cdn.kqed.org/wp-content/uploads/sites/35/2021/07/BOOTLEG_OR_20210709-768x1365.jpg 768w, https://cdn.kqed.org/wp-content/uploads/sites/35/2021/07/BOOTLEG_OR_20210709-864x1536.jpg 864w, https://cdn.kqed.org/wp-content/uploads/sites/35/2021/07/BOOTLEG_OR_20210709.jpg 1080w\" sizes=\"(max-width: 800px) 100vw, 800px\">\u003cfigcaption class=\"wp-caption-text\">Oregon’s Bootleg Fire. \u003ccite>(Image provided by Planet Labs)\u003c/cite>\u003c/figcaption>\u003c/figure>\n\u003cp>\u003cem>This conversation has been lightly edited for length and clarity.\u003c/em>\u003c/p>\n\u003cp>\u003cstrong>Brian Watt: We’ve been told this fire season is already starting off worse than in previous years. Exactly how bad are we talking?\u003c/strong>\u003c/p>\n\u003cp>Paul Rogers: There’s good news and bad news. From January 1 to July 6, California had 4,922 wildfires on state, federal and private land. That is 720 more than we had a year ago over the same time period. The good news is those fires haven’t burned as many acres as we’ve seen in some previous years. They burned 83,000 acres — twice as much as last year during the same time period, but not any kind of record. The reason is because firefighters are on edge right now. They’re throwing all sorts of resources at these fires when they start. Lots of planes, helicopters, boots on the ground. So far, they’ve put most of them out pretty quickly.\u003c/p>\n\u003cp>\u003cstrong>Brian Watt: It’s really hard to imagine this fire situation getting worse. Walk us through what is making this fire season so dire.\u003c/strong>\u003c/p>\n\u003cp>Paul Rogers: I know a lot of folks have gone camping. And if you think when you go camping and you’re sitting there trying to start a campfire, everybody knows wet wood doesn’t really burn very well. But dry wood or dry brush burn very easily. And unfortunately, just about everything around the state right now is dry. And that’s because we’re in the worst drought that California has experienced in 50-years. San Jose experienced its driest year ever in 128 years of record keeping. It got about the same amount of rain — five inches — as Las Vegas or Palm Springs gets in a normal year. And the same in San Francisco, which experienced its third driest year since the gold rush in 1849. This is similar all across California.\u003c/p>\n\u003cp>\u003cstrong>Brian Watt: Add to that, climate change is making our heat waves hotter.\u003c/strong>\u003c/p>\n\u003cp>Paul Rogers: Which further dries out the soil and vegetation. And on top of all that, we’ve had about 100 years of fire suppression. Historically, when you look at forests throughout California, conifer forests up in the Sierra Nevada burned about every decade or two, naturally due to lightning strikes. Those fires cleared out dead vegetation. They left the forests with something like 40 or 50 trees per acre, and those forests were healthy. But after 100 hundred years of people putting out fires, we’ve now got up to 400 trees per acre in some places. The forests are unnaturally thick. They’re choked with dead vegetation. When they do burn, they burn hotter and out of control.\u003c/p>\n\u003cp>\u003cstrong>Brian Watt: Both of you talked to San Jose State researchers who are studying the dry conditions. What have they found?\u003c/strong>\u003c/p>\n\u003cp>Raquel Maria Dillon: Fire scientists are seeing lower vegetation moisture levels than ever before — well, since they started eight years ago measuring in the Bay Area. The researchers know this because they’ve been testing native plants that have evolved to survive and thrive in California. They snip off twigs from a bush called chamise at the same locations every two weeks. They measure that plant material to see how much moisture it holds. The issue is that in a fire, this kind of dry, semi-dormant vegetation becomes fuel for the flames. In firefighting, fuel is trees, grass, brush or buildings. And it’s one of the three sides of the triangle that firefighters talk about when they assess the risk of a major wildfire. The other sides are weather conditions and topography.\u003c/p>\n\u003cfigure id=\"attachment_1975825\" class=\"wp-caption alignnone\" style=\"max-width: 800px\">\u003cimg loading=\"lazy\" decoding=\"async\" class=\"size-medium wp-image-1975825\" src=\"https://ww2.kqed.org/app/uploads/sites/35/2021/07/LAVA_CA_20210628-800x450.jpg\" alt=\"\" width=\"800\" height=\"450\" srcset=\"https://cdn.kqed.org/wp-content/uploads/sites/35/2021/07/LAVA_CA_20210628-800x450.jpg 800w, https://cdn.kqed.org/wp-content/uploads/sites/35/2021/07/LAVA_CA_20210628-1020x574.jpg 1020w, https://cdn.kqed.org/wp-content/uploads/sites/35/2021/07/LAVA_CA_20210628-160x90.jpg 160w, https://cdn.kqed.org/wp-content/uploads/sites/35/2021/07/LAVA_CA_20210628-768x432.jpg 768w, https://cdn.kqed.org/wp-content/uploads/sites/35/2021/07/LAVA_CA_20210628-1536x864.jpg 1536w, https://cdn.kqed.org/wp-content/uploads/sites/35/2021/07/LAVA_CA_20210628.jpg 1920w\" sizes=\"(max-width: 800px) 100vw, 800px\">\u003cfigcaption class=\"wp-caption-text\">The Lava Fire was ignited by a lightning strike northeast of the community of Weed, California. This image has been rotated. \u003ccite>(Image provided by Planet Labs.)\u003c/cite>\u003c/figcaption>\u003c/figure>\n\u003cp>\u003cstrong>Brian Watt: What do these dry conditions mean for fire danger around the Bay Area?\u003c/strong>\u003c/p>\n\u003cp>Paul Rogers: Well, all places are not created equal when it comes to fire danger. There’s an area that fire experts call the wildland urban interface, or WUI, and that’s basically places where homes have been built right next to forests and chaparral, and other fire-prone areas. Those types of places are at particular risk. Think about communities in the East Bay Hills, where we had the historic Oakland Hills fire in 1991 that killed 25 people and burned nearly 3,000 homes, towns like Mill Valley up against Mount Tamalpais, towns in the Santa Cruz Mountains from Los Gatos all the way up to Boulder Creek, where the CZU fire burned a thousand homes last year and also all around Lake Tahoe. That’s a particular risk. It’s surrounded by forest and there are very few roads in and out.\u003c/p>\n\u003cp>\u003cstrong>Brian Watt: How are fire officials in the Bay Area getting ready for this, to respond to this elevated risk?\u003c/strong>\u003c/p>\n\u003cp>Raquel Maria Dillon: Well, it sort of depends on the jurisdiction and their budget. One example is in Berkeley, where the city is sending an extra $12 million to the fire department to prepare to improve emergency warning systems and clear more dry brush and other fire prevention projects. That money came from a ballot measure that Berkeley voters passed in 2020. Fire officials and elected officials are also begging homeowners to clear away vegetation around their homes. They say it’s a neighborhood effort and everybody has to be in it together because these neighborhoods have burned before.\u003c/p>\n\u003cp>\u003cstrong>Brian Watt: Anyone who has hiked in the East Bay Hills recently knows, it just feels dry out there. How exactly are the dry conditions affecting the forests in the region?\u003c/strong>\u003c/p>\n\u003cfigure id=\"attachment_1975826\" class=\"wp-caption alignright\" style=\"max-width: 800px\">\u003cimg loading=\"lazy\" decoding=\"async\" class=\"size-medium wp-image-1975826\" src=\"https://ww2.kqed.org/app/uploads/sites/35/2021/07/DRYGULCH_WA_20210710-800x1422.jpg\" alt=\"\" width=\"800\" height=\"1422\" srcset=\"https://cdn.kqed.org/wp-content/uploads/sites/35/2021/07/DRYGULCH_WA_20210710-800x1422.jpg 800w, https://cdn.kqed.org/wp-content/uploads/sites/35/2021/07/DRYGULCH_WA_20210710-1020x1813.jpg 1020w, https://cdn.kqed.org/wp-content/uploads/sites/35/2021/07/DRYGULCH_WA_20210710-160x284.jpg 160w, https://cdn.kqed.org/wp-content/uploads/sites/35/2021/07/DRYGULCH_WA_20210710-768x1365.jpg 768w, https://cdn.kqed.org/wp-content/uploads/sites/35/2021/07/DRYGULCH_WA_20210710-864x1536.jpg 864w, https://cdn.kqed.org/wp-content/uploads/sites/35/2021/07/DRYGULCH_WA_20210710.jpg 1080w\" sizes=\"(max-width: 800px) 100vw, 800px\">\u003cfigcaption class=\"wp-caption-text\">Washington’s Dry Gulch Fire. \u003ccite>(Image provided by Planet Labs.)\u003c/cite>\u003c/figcaption>\u003c/figure>\n\u003cp>Raquel Maria Dillon: Yeah, it’s dry all over. In my backyard. In the forests and parks. The entire region is experiencing a tree die-off. Foresters with the East Bay Regional Parks District first identified dead or dying trees this spring. They don’t know exactly what’s causing this tree mortality, but it’s affecting all different kinds of species. It’s likely drought-related, but it could be bark beetles or a fungus.\u003c/p>\n\u003cp>At this point, it doesn’t matter to them. They’re focused on mitigation, and that means clearing away dead trees and brush and conducting controlled burns. But that kind of thing is expensive. The parks district in the East Bay has spent more than $5 million on vegetation management in the past couple of years. Now, their big goal is to expand prescribed burns, which is super complicated here because there are so many different jurisdictions that have a say in when and how they can burn. Plus, there are valid concerns about air quality. But fire officials are surprisingly hopeful because of the recent episodes of extremely bad air quality. The public is more open to prescribed burns than ever before.\u003c/p>\n\u003cp>\u003cstrong>Brian Watt: Paul, we’ve been hearing about prescribed burns and that controlled burns are actually key to restoring forest health and mitigating big fire. How is California doing with prescribed burns?\u003c/strong>\u003c/p>\n\u003cp>Paul Rogers: Not particularly well. The state has 100 million acres in total land area, about 20 million acres are forests that need to be thinned or cleared with prescribed fires. The problem is that you can’t do these kinds of controlled burns in the summer. They explode out of control. What you have to do is mechanical thinning. First, you’ve got to get out there with chainsaws. But there isn’t really much of a market for a lot of this dead wood. It’s expensive. It’s going to be a big job. California treated about 300,000 acres last year and needs to do about a million acres a year. It’ll take many years and billions of dollars to get this job done.\u003c/p>\n\u003cp>\u003cstrong>Brian Watt: Could we be coming up on a situation where we’ve got fire season, and then we’ve got prescribed burn season?\u003c/strong>\u003c/p>\n\u003cp>Paul Rogers: Yes, I think so.\u003c/p>\n\u003cp>\u003cstrong>Brian Watt: Prescribed fire season?\u003c/strong>\u003c/p>\n\u003cp>Paul Rogers: Prescribed burns work best when the ground is a little bit wet and you don’t have the risk of the fires getting out of control. Once officials do a mechanical thinning of an area, they have to come back with prescribed burns to keep the conditions right; that continues in perpetuity, when you live in an area with a Mediterranean climate that’s prone to fire.\u003c/p>\n\u003cp>[ad fullwidth]\u003c/p>\n\u003cp>[ad floatright]\u003c/p>\n",
"stats": {
"hasVideo": false,
"hasChartOrMap": false,
"hasAudio": false,
"hasPolis": false,
"wordCount": 1674,
"hasGoogleForm": false,
"hasGallery": false,
"hasHearkenModule": false,
"iframeSrcs": [],
"paragraphCount": 29
},
"modified": 1704846513,
"excerpt": "California is not alone, wildfires are ripping through forests, torching homes, and forcing evacuations across the West.",
"headData": {
"twImgId": "",
"twTitle": "",
"ogTitle": "",
"ogImgId": "",
"twDescription": "",
"description": "California is not alone, wildfires are ripping through forests, torching homes, and forcing evacuations across the West.",
"title": "A Harrowing California Fire Season is Here, Fueled by Historic Drought | KQED",
"ogDescription": "",
"schema": {
"@context": "https://schema.org",
"@type": "Article",
"headline": "A Harrowing California Fire Season is Here, Fueled by Historic Drought",
"datePublished": "2021-07-19T06:00:04-07:00",
"dateModified": "2024-01-09T16:28:33-08:00",
"image": "https://cdn.kqed.org/wp-content/uploads/2020/02/KQED-OG-Image@1x.png"
}
},
"guestAuthors": [],
"slug": "a-punishing-california-fire-season-is-here-fueled-by-historic-drought",
"status": "publish",
"audioUrl": "https://traffic.omny.fm/d/clips/0af137ef-751e-4b19-a055-aaef00d2d578/ffca7e9f-6831-4[…]f-aaef00f5a073/c95ce76f-8674-426f-b85e-ad6a0128135e/audio.mp3",
"sticky": false,
"source": "Wildfire",
"path": "/science/1975814/a-punishing-california-fire-season-is-here-fueled-by-historic-drought",
"audioTrackLength": null,
"parsedContent": [
{
"type": "contentString",
"content": "\u003cdiv class=\"post-body\">\u003cp>\u003cp>Two years of record dry winters and scorching early summer heat waves have primed forests across California to burn, just as the state heads into the hottest months of summer.\u003c/p>\n\u003cp>Fire season is here; fast, furious and early — exacerbated by dry conditions across most of the state, Paul Rogers, with the Mercury News, \u003ca href=\"https://www.mercurynews.com/2021/07/11/how-bad-is-this-fire-season-in-california-really-going-to-be/\">\u003cspan class=\"s1\">reported,\u003c/span>\u003c/a> writing that “memories of last year’s destructive fires are still fresh.”\u003c/p>\n\u003cp>“Remember, last year we saw the most acres burned in California as we’d ever seen in recorded history — 4.3 million acres burned,” Rogers said. “One out of every 24 acres of land in California burned last year. This year, like last year, it’s all about drought.”\u003c/p>\n\u003cp>And California is not alone, wildfires are ripping through forests, torching homes, and forcing evacuations \u003ca href=\"https://www.kqed.org/news/11881024/we-are-under-extreme-weather-conditions-wildfires-rage-from-california-to-alaska\">\u003cspan class=\"s1\">across the Western U.S.\u003c/span>\u003c/a> The largest wildfire of the year has incinerated an area more than twice the size of the city of Portland and is still burning in southwestern Oregon.\u003c/p>\n\u003cp>Rogers and KQED’s Raquel Maria Dillon spoke with Brian Watt, KQED’s morning news anchor, about how the drought is exacerbating the fire season.\u003c/p>\n\u003cfigure id=\"attachment_1975816\" class=\"wp-caption alignright\" style=\"max-width: 800px\">\u003cimg loading=\"lazy\" decoding=\"async\" class=\"size-medium wp-image-1975816\" src=\"https://ww2.kqed.org/app/uploads/sites/35/2021/07/BOOTLEG_OR_20210709-800x1422.jpg\" alt=\"\" width=\"800\" height=\"1422\" srcset=\"https://cdn.kqed.org/wp-content/uploads/sites/35/2021/07/BOOTLEG_OR_20210709-800x1422.jpg 800w, https://cdn.kqed.org/wp-content/uploads/sites/35/2021/07/BOOTLEG_OR_20210709-1020x1813.jpg 1020w, https://cdn.kqed.org/wp-content/uploads/sites/35/2021/07/BOOTLEG_OR_20210709-160x284.jpg 160w, https://cdn.kqed.org/wp-content/uploads/sites/35/2021/07/BOOTLEG_OR_20210709-768x1365.jpg 768w, https://cdn.kqed.org/wp-content/uploads/sites/35/2021/07/BOOTLEG_OR_20210709-864x1536.jpg 864w, https://cdn.kqed.org/wp-content/uploads/sites/35/2021/07/BOOTLEG_OR_20210709.jpg 1080w\" sizes=\"(max-width: 800px) 100vw, 800px\">\u003cfigcaption class=\"wp-caption-text\">Oregon’s Bootleg Fire. \u003ccite>(Image provided by Planet Labs)\u003c/cite>\u003c/figcaption>\u003c/figure>\n\u003cp>\u003cem>This conversation has been lightly edited for length and clarity.\u003c/em>\u003c/p>\n\u003cp>\u003cstrong>Brian Watt: We’ve been told this fire season is already starting off worse than in previous years. Exactly how bad are we talking?\u003c/strong>\u003c/p>\n\u003cp>Paul Rogers: There’s good news and bad news. From January 1 to July 6, California had 4,922 wildfires on state, federal and private land. That is 720 more than we had a year ago over the same time period. The good news is those fires haven’t burned as many acres as we’ve seen in some previous years. They burned 83,000 acres — twice as much as last year during the same time period, but not any kind of record. The reason is because firefighters are on edge right now. They’re throwing all sorts of resources at these fires when they start. Lots of planes, helicopters, boots on the ground. So far, they’ve put most of them out pretty quickly.\u003c/p>\n\u003cp>\u003cstrong>Brian Watt: It’s really hard to imagine this fire situation getting worse. Walk us through what is making this fire season so dire.\u003c/strong>\u003c/p>\n\u003cp>Paul Rogers: I know a lot of folks have gone camping. And if you think when you go camping and you’re sitting there trying to start a campfire, everybody knows wet wood doesn’t really burn very well. But dry wood or dry brush burn very easily. And unfortunately, just about everything around the state right now is dry. And that’s because we’re in the worst drought that California has experienced in 50-years. San Jose experienced its driest year ever in 128 years of record keeping. It got about the same amount of rain — five inches — as Las Vegas or Palm Springs gets in a normal year. And the same in San Francisco, which experienced its third driest year since the gold rush in 1849. This is similar all across California.\u003c/p>\n\u003cp>\u003cstrong>Brian Watt: Add to that, climate change is making our heat waves hotter.\u003c/strong>\u003c/p>\n\u003cp>Paul Rogers: Which further dries out the soil and vegetation. And on top of all that, we’ve had about 100 years of fire suppression. Historically, when you look at forests throughout California, conifer forests up in the Sierra Nevada burned about every decade or two, naturally due to lightning strikes. Those fires cleared out dead vegetation. They left the forests with something like 40 or 50 trees per acre, and those forests were healthy. But after 100 hundred years of people putting out fires, we’ve now got up to 400 trees per acre in some places. The forests are unnaturally thick. They’re choked with dead vegetation. When they do burn, they burn hotter and out of control.\u003c/p>\n\u003cp>\u003cstrong>Brian Watt: Both of you talked to San Jose State researchers who are studying the dry conditions. What have they found?\u003c/strong>\u003c/p>\n\u003cp>Raquel Maria Dillon: Fire scientists are seeing lower vegetation moisture levels than ever before — well, since they started eight years ago measuring in the Bay Area. The researchers know this because they’ve been testing native plants that have evolved to survive and thrive in California. They snip off twigs from a bush called chamise at the same locations every two weeks. They measure that plant material to see how much moisture it holds. The issue is that in a fire, this kind of dry, semi-dormant vegetation becomes fuel for the flames. In firefighting, fuel is trees, grass, brush or buildings. And it’s one of the three sides of the triangle that firefighters talk about when they assess the risk of a major wildfire. The other sides are weather conditions and topography.\u003c/p>\n\u003cfigure id=\"attachment_1975825\" class=\"wp-caption alignnone\" style=\"max-width: 800px\">\u003cimg loading=\"lazy\" decoding=\"async\" class=\"size-medium wp-image-1975825\" src=\"https://ww2.kqed.org/app/uploads/sites/35/2021/07/LAVA_CA_20210628-800x450.jpg\" alt=\"\" width=\"800\" height=\"450\" srcset=\"https://cdn.kqed.org/wp-content/uploads/sites/35/2021/07/LAVA_CA_20210628-800x450.jpg 800w, https://cdn.kqed.org/wp-content/uploads/sites/35/2021/07/LAVA_CA_20210628-1020x574.jpg 1020w, https://cdn.kqed.org/wp-content/uploads/sites/35/2021/07/LAVA_CA_20210628-160x90.jpg 160w, https://cdn.kqed.org/wp-content/uploads/sites/35/2021/07/LAVA_CA_20210628-768x432.jpg 768w, https://cdn.kqed.org/wp-content/uploads/sites/35/2021/07/LAVA_CA_20210628-1536x864.jpg 1536w, https://cdn.kqed.org/wp-content/uploads/sites/35/2021/07/LAVA_CA_20210628.jpg 1920w\" sizes=\"(max-width: 800px) 100vw, 800px\">\u003cfigcaption class=\"wp-caption-text\">The Lava Fire was ignited by a lightning strike northeast of the community of Weed, California. This image has been rotated. \u003ccite>(Image provided by Planet Labs.)\u003c/cite>\u003c/figcaption>\u003c/figure>\n\u003cp>\u003cstrong>Brian Watt: What do these dry conditions mean for fire danger around the Bay Area?\u003c/strong>\u003c/p>\n\u003cp>Paul Rogers: Well, all places are not created equal when it comes to fire danger. There’s an area that fire experts call the wildland urban interface, or WUI, and that’s basically places where homes have been built right next to forests and chaparral, and other fire-prone areas. Those types of places are at particular risk. Think about communities in the East Bay Hills, where we had the historic Oakland Hills fire in 1991 that killed 25 people and burned nearly 3,000 homes, towns like Mill Valley up against Mount Tamalpais, towns in the Santa Cruz Mountains from Los Gatos all the way up to Boulder Creek, where the CZU fire burned a thousand homes last year and also all around Lake Tahoe. That’s a particular risk. It’s surrounded by forest and there are very few roads in and out.\u003c/p>\n\u003cp>\u003cstrong>Brian Watt: How are fire officials in the Bay Area getting ready for this, to respond to this elevated risk?\u003c/strong>\u003c/p>\n\u003cp>Raquel Maria Dillon: Well, it sort of depends on the jurisdiction and their budget. One example is in Berkeley, where the city is sending an extra $12 million to the fire department to prepare to improve emergency warning systems and clear more dry brush and other fire prevention projects. That money came from a ballot measure that Berkeley voters passed in 2020. Fire officials and elected officials are also begging homeowners to clear away vegetation around their homes. They say it’s a neighborhood effort and everybody has to be in it together because these neighborhoods have burned before.\u003c/p>\n\u003cp>\u003cstrong>Brian Watt: Anyone who has hiked in the East Bay Hills recently knows, it just feels dry out there. How exactly are the dry conditions affecting the forests in the region?\u003c/strong>\u003c/p>\n\u003cfigure id=\"attachment_1975826\" class=\"wp-caption alignright\" style=\"max-width: 800px\">\u003cimg loading=\"lazy\" decoding=\"async\" class=\"size-medium wp-image-1975826\" src=\"https://ww2.kqed.org/app/uploads/sites/35/2021/07/DRYGULCH_WA_20210710-800x1422.jpg\" alt=\"\" width=\"800\" height=\"1422\" srcset=\"https://cdn.kqed.org/wp-content/uploads/sites/35/2021/07/DRYGULCH_WA_20210710-800x1422.jpg 800w, https://cdn.kqed.org/wp-content/uploads/sites/35/2021/07/DRYGULCH_WA_20210710-1020x1813.jpg 1020w, https://cdn.kqed.org/wp-content/uploads/sites/35/2021/07/DRYGULCH_WA_20210710-160x284.jpg 160w, https://cdn.kqed.org/wp-content/uploads/sites/35/2021/07/DRYGULCH_WA_20210710-768x1365.jpg 768w, https://cdn.kqed.org/wp-content/uploads/sites/35/2021/07/DRYGULCH_WA_20210710-864x1536.jpg 864w, https://cdn.kqed.org/wp-content/uploads/sites/35/2021/07/DRYGULCH_WA_20210710.jpg 1080w\" sizes=\"(max-width: 800px) 100vw, 800px\">\u003cfigcaption class=\"wp-caption-text\">Washington’s Dry Gulch Fire. \u003ccite>(Image provided by Planet Labs.)\u003c/cite>\u003c/figcaption>\u003c/figure>\n\u003cp>Raquel Maria Dillon: Yeah, it’s dry all over. In my backyard. In the forests and parks. The entire region is experiencing a tree die-off. Foresters with the East Bay Regional Parks District first identified dead or dying trees this spring. They don’t know exactly what’s causing this tree mortality, but it’s affecting all different kinds of species. It’s likely drought-related, but it could be bark beetles or a fungus.\u003c/p>\n\u003cp>At this point, it doesn’t matter to them. They’re focused on mitigation, and that means clearing away dead trees and brush and conducting controlled burns. But that kind of thing is expensive. The parks district in the East Bay has spent more than $5 million on vegetation management in the past couple of years. Now, their big goal is to expand prescribed burns, which is super complicated here because there are so many different jurisdictions that have a say in when and how they can burn. Plus, there are valid concerns about air quality. But fire officials are surprisingly hopeful because of the recent episodes of extremely bad air quality. The public is more open to prescribed burns than ever before.\u003c/p>\n\u003cp>\u003cstrong>Brian Watt: Paul, we’ve been hearing about prescribed burns and that controlled burns are actually key to restoring forest health and mitigating big fire. How is California doing with prescribed burns?\u003c/strong>\u003c/p>\n\u003cp>Paul Rogers: Not particularly well. The state has 100 million acres in total land area, about 20 million acres are forests that need to be thinned or cleared with prescribed fires. The problem is that you can’t do these kinds of controlled burns in the summer. They explode out of control. What you have to do is mechanical thinning. First, you’ve got to get out there with chainsaws. But there isn’t really much of a market for a lot of this dead wood. It’s expensive. It’s going to be a big job. California treated about 300,000 acres last year and needs to do about a million acres a year. It’ll take many years and billions of dollars to get this job done.\u003c/p>\n\u003cp>\u003cstrong>Brian Watt: Could we be coming up on a situation where we’ve got fire season, and then we’ve got prescribed burn season?\u003c/strong>\u003c/p>\n\u003cp>Paul Rogers: Yes, I think so.\u003c/p>\n\u003cp>\u003cstrong>Brian Watt: Prescribed fire season?\u003c/strong>\u003c/p>\n\u003cp>Paul Rogers: Prescribed burns work best when the ground is a little bit wet and you don’t have the risk of the fires getting out of control. Once officials do a mechanical thinning of an area, they have to come back with prescribed burns to keep the conditions right; that continues in perpetuity, when you live in an area with a Mediterranean climate that’s prone to fire.\u003c/p>\n\u003cp>\u003c/p>\u003c/div>",
"attributes": {
"named": {},
"numeric": []
}
},
{
"type": "component",
"content": "",
"name": "ad",
"attributes": {
"named": {
"label": "fullwidth"
},
"numeric": [
"fullwidth"
]
}
},
{
"type": "contentString",
"content": "\u003cdiv class=\"post-body\">\u003cp>\u003c/p>\n\u003cp>\u003c/p>\u003c/div>",
"attributes": {
"named": {},
"numeric": []
}
},
{
"type": "component",
"content": "",
"name": "ad",
"attributes": {
"named": {
"label": "floatright"
},
"numeric": [
"floatright"
]
}
},
{
"type": "contentString",
"content": "\u003cdiv class=\"post-body\">\u003cp>\u003c/p>\n\u003c/div>\u003c/p>",
"attributes": {
"named": {},
"numeric": []
}
}
],
"link": "/science/1975814/a-punishing-california-fire-season-is-here-fueled-by-historic-drought",
"authors": [
"11608",
"11501"
],
"categories": [
"science_31",
"science_35",
"science_40",
"science_4450",
"science_3730"
],
"tags": [
"science_194",
"science_4414",
"science_2184",
"science_113"
],
"featImg": "science_1975845",
"label": "source_science_1975814"
},
"science_1974894": {
"type": "posts",
"id": "science_1974894",
"meta": {
"index": "posts_1716263798",
"site": "science",
"id": "1974894",
"score": null,
"sort": [
1622231845000
]
},
"parent": 0,
"labelTerm": {
"site": "science"
},
"blocks": [],
"publishDate": 1622231845,
"format": "aside",
"title": "QUIZ: Planning Travel This Summer? How to Keep Your COVID Risk Low",
"headTitle": "QUIZ: Planning Travel This Summer? How to Keep Your COVID Risk Low | KQED",
"content": "\u003cp>\u003c!-- iframe plugin v.4.3 wordpress.org/plugins/iframe/ -->\u003cbr>\n\u003ciframe loading=\"lazy\" src=\"https://www.qzzr.com/c/quiz/484871/how-to-keep-your-coronavirus-risk-low-during-summer-travel\" width=\"100%\" height=\"750\" scrolling=\"yes\" class=\"iframe-class\" frameborder=\"0\">\u003c/iframe>\u003c/p>\n\u003cp>[ad fullwidth]\u003c/p>\u003cp>\u003c/p>\n",
"stats": {
"hasVideo": false,
"hasChartOrMap": true,
"hasAudio": false,
"hasPolis": false,
"wordCount": 2,
"hasGoogleForm": false,
"hasGallery": false,
"hasHearkenModule": false,
"iframeSrcs": [
"https://www.qzzr.com/c/quiz/484871/how-to-keep-your-coronavirus-risk-low-during-summer-travel"
],
"paragraphCount": 3
},
"modified": 1704846581,
"excerpt": "Figuring out how to weigh the importance of masks, vaccines and distancing during travel can be tough. Here's a guide to how to protect yourself and loved ones.",
"headData": {
"twImgId": "",
"twTitle": "",
"ogTitle": "",
"ogImgId": "",
"twDescription": "",
"description": "Figuring out how to weigh the importance of masks, vaccines and distancing during travel can be tough. Here's a guide to how to protect yourself and loved ones.",
"title": "QUIZ: Planning Travel This Summer? How to Keep Your COVID Risk Low | KQED",
"ogDescription": "",
"schema": {
"@context": "https://schema.org",
"@type": "Article",
"headline": "QUIZ: Planning Travel This Summer? How to Keep Your COVID Risk Low",
"datePublished": "2021-05-28T12:57:25-07:00",
"dateModified": "2024-01-09T16:29:41-08:00",
"image": "https://cdn.kqed.org/wp-content/uploads/2020/02/KQED-OG-Image@1x.png"
}
},
"guestAuthors": [],
"slug": "quiz-planning-travel-this-summer-how-to-keep-your-covid-risk-low",
"status": "publish",
"sticky": false,
"path": "/science/1974894/quiz-planning-travel-this-summer-how-to-keep-your-covid-risk-low",
"audioTrackLength": null,
"parsedContent": [
{
"type": "contentString",
"content": "\u003cdiv class=\"post-body\">\u003cp>\u003cp>\u003c!-- iframe plugin v.4.3 wordpress.org/plugins/iframe/ -->\u003cbr>\n\u003ciframe loading=\"lazy\" src=\"https://www.qzzr.com/c/quiz/484871/how-to-keep-your-coronavirus-risk-low-during-summer-travel\" width=\"100%\" height=\"750\" scrolling=\"yes\" class=\"iframe-class\" frameborder=\"0\">\u003c/iframe>\u003c/p>\n\u003cp>\u003c/p>\u003c/div>",
"attributes": {
"named": {},
"numeric": []
}
},
{
"type": "component",
"content": "",
"name": "ad",
"attributes": {
"named": {
"label": "fullwidth"
},
"numeric": [
"fullwidth"
]
}
},
{
"type": "contentString",
"content": "\u003cdiv class=\"post-body\">\u003cp>\u003c/p>\u003cp>\u003c/p>\n\u003c/div>\u003c/p>",
"attributes": {
"named": {},
"numeric": []
}
}
],
"link": "/science/1974894/quiz-planning-travel-this-summer-how-to-keep-your-covid-risk-low",
"authors": [
"11501",
"11368"
],
"categories": [
"science_4450"
],
"featImg": "science_1975003",
"label": "science"
},
"science_1974195": {
"type": "posts",
"id": "science_1974195",
"meta": {
"index": "posts_1716263798",
"site": "science",
"id": "1974195",
"score": null,
"sort": [
1619712037000
]
},
"parent": 0,
"labelTerm": {},
"blocks": [],
"publishDate": 1619712037,
"format": "aside",
"title": "Mapa: Descubre cuáles lugares del Área de la Bahía están en riesgo de inundación por el aumento del nivel del mar",
"headTitle": "Mapa: Descubre cuáles lugares del Área de la Bahía están en riesgo de inundación por el aumento del nivel del mar | KQED",
"content": "\u003cp>\u003cem>Esta serie es parte de la iniciativa nacional de periodismo ‘\u003ca href=\"http://connected-coastlines.pulitzercenter.org/\" target=\"_blank\" rel=\"noopener noreferrer\">Connected Coastlines\u003c/a>‘ del Centro Pulitzer.\u003c/em>\u003c/p>\n\u003cp>\u003ca href=\"https://www.kqed.org/science/1973624/maps-see-which-bay-area-locations-are-at-risk-from-rising-seas\" target=\"_blank\" rel=\"noopener noreferrer\">\u003cem>Read in English\u003c/em>\u003c/a>\u003c/p>\n\u003ch5>Una proyección del aumento del nivel del mar en el Área de la Bahía hasta el 2050\u003c/h5>\n\u003cp style=\"line-height: 90%\">\u003cspan style=\"font-size: small\">\u003cem>Puede mover su mouse para explorar las direcciones del mapa. Puede usar los signos (+) y (-) para acercarse o alejarse. Selecciona la lupa para buscar una dirección específica. Para esconder la leyenda, selecciona la flecha hacia abajo que está ubicada al lado derecho de la leyenda del mapa. Fuentes: USGS, OCOF, Pacific Institute\u003c/em>\u003c/span>\u003cbr>\n\u003c!-- iframe plugin v.4.3 wordpress.org/plugins/iframe/ -->\u003cbr>\n\u003ciframe loading=\"lazy\" src=\"https://kqed.carto.com/u/kqednews/builder/13e1ca7c-3df3-4f40-bcd3-8072f22d9e6c/embed\" width=\"100%\" height=\"500\" scrolling=\"yes\" class=\"iframe-class\" frameborder=\"0\">\u003c/iframe>\n\u003c/p>\n\u003cp>El nivel de la marea alta de la bahía se dirige en una dirección: arriba. Los modelos utilizados en \u003ca href=\"http://www.opc.ca.gov/webmaster/ftp/pdf/docs/rising-seas-in-california-an-update-on-sea-level-rise-science.pdf\" target=\"_blank\" rel=\"noopener noreferrer\">la última evaluación\u003c/a> del aumento del nivel del mar del estado de California, en 2017, incluyen un rango superior que está definido en términos de eventos estadísticamente menos probables. Muestran que la bahía podría elevarse hasta 1.9 pies para el año 2050 y 6.9 pies para los fines de siglo, que son mayores que los niveles demostrados en los dos mapas de esta página.\u003c/p>\n\u003cp>Pero esto podría empeorar aún más: las ciudades que ya se están preparando para posibles inundaciones en los próximos años también tienen que preocuparse por unos metros adicionales de agua que se estrellan contra las costas durante una tormenta intensa.\u003c/p>\n\u003cp>Durante las tormentas, East Palo Alto y otras ciudades a lo largo de la costa de la bahía ya sufren inundaciones y erosión costera, que solo se verán agravadas por el esperando aumento del nivel del mar.\u003c/p>\n\u003cp>“El aumento del nivel del mar es uno de los efectos más seguros del cambio climático”, dijo \u003ca href=\"https://ce.berkeley.edu/people/faculty/stacey\" target=\"_blank\" rel=\"noopener noreferrer\">Mark Stacey\u003c/a>, ingeniero ambiental de UC Berkeley. “Sabemos que gran parte de eso ya está fijo, y sabemos que los mares seguirán aumentando a un ritmo constante y quizás acelerándose en las próximas décadas”.\u003c/p>\n\u003cp>Son pocas las diferencias entre los escenarios de modelado científico antes del año 2050 , pero estas cambian drásticamente después de mediados de siglo de acuerdo conla trayectoria de las emisiones de gases de efecto invernadero, lo cual queda en manos de los seres humanos, y el destino de las placas de hielo en Groenlandia y la Antártida.\u003c/p>\n\u003ch5>Una proyección del aumento del nivel del mar en el Área de la Bahía en 2100\u003c/h5>\n\u003cp style=\"line-height: 90%\">\u003cspan style=\"font-size: small\">\u003cem>Puede mover su mouse para explorar las direcciones del mapa. Puede usar los signos (+) y (-) para acercarse o alejarse. Selecciona la lupa para buscar una dirección específica. Para esconder la leyenda, selecciona la flecha hacia abajo que está ubicada al lado derecho de la leyenda del mapa. Fuentes: USGS, OCOF, Pacific Institute\u003c/em>\u003c/span>\u003cbr>\n\u003c!-- iframe plugin v.4.3 wordpress.org/plugins/iframe/ -->\u003cbr>\n\u003ciframe loading=\"lazy\" src=\"https://kqed.carto.com/u/kqednews/builder/6f66d357-18dc-49af-95d7-f34ca39e38b7/embed\" width=\"100%\" height=\"500\" scrolling=\"yes\" class=\"iframe-class\" frameborder=\"0\">\u003c/iframe>\n\u003c/p>\n\u003cp>Los mapas o modelos científicos no cuentan una historia más drástica, en el que las placas de hielo de Groenlandia y la Antártida colapsan. Pero si esto ocurre, el Área de la Bahía podría ver un aumento de 10 pies del nivel del mar para el 2100, lo que Stacey llama una “aceleración masiva” de 30 a 40 veces más rápida que la tasa de aumento que hemos visto durante el último siglo.\u003c/p>\n\u003cp>“Esto se extiende más allá del alcance de lo que hemos pensado en nuestro horizonte de planificación en términos de la magnitud del cambio que enfrentaremos en esta región”, dijo, y agregó que tal aumento requeriría un “replanteamiento completo de la comunidades en todo el Área de la Bahía, y un cambio de sistemas de infraestructura que sería bastante profundo “.\u003c/p>\n\u003cp>La evaluación del estado dice: “Las reducciones agresivas en las emisiones de gases de efecto invernadero pueden reducir sustancialmente, pero no eliminar, el riesgo de un aumento extremo del nivel del mar en California debido a la pérdida de hielo antártico”.\u003c/p>\n\u003cp>\u003cstrong>Fuente de datos\u003c/strong>\u003cbr>\n\u003cem>Las proyecciones para las inundaciones del Área de la Bahía provienen del escenario 8.5 del “sendero de concentración representativa” o representative concentration pathway en inglés del Panel Intergubernamental sobre el Cambio Climático, como se detalla en \u003ca href=\"http://www.opc.ca.gov/webmaster/ftp/pdf/docs/rising-seas-in-california-an-update-on-sea-level-rise-science.pdf\" target=\"_blank\" rel=\"noopener noreferrer\">la última evaluación científica\u003c/a> del aumento del nivel del mar en California, dirigida por Gary Griggs de UC Santa Cruz.\u003c/em>\u003c/p>\n\u003cp>\u003cem>El escenario asume que “no hay esfuerzos globales significativos para limitar o reducir las emisiones”.\u003c/em>\u003c/p>\n\u003cp>\u003cem>Los mapas utilizan un modelo dinámico de \u003ca href=\"http://ourcoastourfuture.org/\" target=\"_blank\" rel=\"noopener noreferrer\">Our Coast, Our Future\u003c/a>. Las inundaciones estimadas son aproximaciones. Los datos provienen del U.S. Geological Survey Coastal Storm Modeling System 9 CoSMoS v2.1; Barnard et al, 2014.\u003c/em>\u003c/p>\n\u003cp>\u003cem>Este artículo fue traducido por la periodista, \u003ca href=\"https://www.kqed.org/author/lblanco\" target=\"_blank\" rel=\"noopener noreferrer\">Lina Blanco\u003c/a> y editado por la periodista \u003ca href=\"https://www.kqed.org/author/amorga\" target=\"_blank\" rel=\"noopener noreferrer\">Adriana Morga\u003c/a>. \u003c/em>\u003c/p>\n\u003cp>[ad fullwidth]\u003c/p>\n\u003cp>\u003c/p>\n",
"stats": {
"hasVideo": false,
"hasChartOrMap": true,
"hasAudio": false,
"hasPolis": false,
"wordCount": 893,
"hasGoogleForm": false,
"hasGallery": false,
"hasHearkenModule": false,
"iframeSrcs": [
"https://kqed.carto.com/u/kqednews/builder/13e1ca7c-3df3-4f40-bcd3-8072f22d9e6c/embed",
"https://kqed.carto.com/u/kqednews/builder/6f66d357-18dc-49af-95d7-f34ca39e38b7/embed"
],
"paragraphCount": 16
},
"modified": 1704846645,
"excerpt": "El nivel de la marea alta de la bahía se dirige en una dirección: arriba. Explora los lugares del Área de la Bahía que están en riesgo de inundación por el aumento del nivel del mar hasta 2050 y 2100. ",
"headData": {
"twImgId": "",
"twTitle": "",
"ogTitle": "",
"ogImgId": "",
"twDescription": "",
"description": "El nivel de la marea alta de la bahía se dirige en una dirección: arriba. Explora los lugares del Área de la Bahía que están en riesgo de inundación por el aumento del nivel del mar hasta 2050 y 2100. ",
"title": "Mapa: Descubre cuáles lugares del Área de la Bahía están en riesgo de inundación por el aumento del nivel del mar | KQED",
"ogDescription": "",
"schema": {
"@context": "https://schema.org",
"@type": "Article",
"headline": "Mapa: Descubre cuáles lugares del Área de la Bahía están en riesgo de inundación por el aumento del nivel del mar",
"datePublished": "2021-04-29T09:00:37-07:00",
"dateModified": "2024-01-09T16:30:45-08:00",
"image": "https://cdn.kqed.org/wp-content/uploads/2020/02/KQED-OG-Image@1x.png"
}
},
"guestAuthors": [],
"slug": "mapa-ver-los-lugares-en-riesgo-de-inundacion-por-el-aumento-del-nivel-del-mar",
"status": "publish",
"sticky": false,
"source": "Sea Level Rise",
"path": "/science/1974195/mapa-ver-los-lugares-en-riesgo-de-inundacion-por-el-aumento-del-nivel-del-mar",
"audioTrackLength": null,
"parsedContent": [
{
"type": "contentString",
"content": "\u003cdiv class=\"post-body\">\u003cp>\u003cp>\u003cem>Esta serie es parte de la iniciativa nacional de periodismo ‘\u003ca href=\"http://connected-coastlines.pulitzercenter.org/\" target=\"_blank\" rel=\"noopener noreferrer\">Connected Coastlines\u003c/a>‘ del Centro Pulitzer.\u003c/em>\u003c/p>\n\u003cp>\u003ca href=\"https://www.kqed.org/science/1973624/maps-see-which-bay-area-locations-are-at-risk-from-rising-seas\" target=\"_blank\" rel=\"noopener noreferrer\">\u003cem>Read in English\u003c/em>\u003c/a>\u003c/p>\n\u003ch5>Una proyección del aumento del nivel del mar en el Área de la Bahía hasta el 2050\u003c/h5>\n\u003cp style=\"line-height: 90%\">\u003cspan style=\"font-size: small\">\u003cem>Puede mover su mouse para explorar las direcciones del mapa. Puede usar los signos (+) y (-) para acercarse o alejarse. Selecciona la lupa para buscar una dirección específica. Para esconder la leyenda, selecciona la flecha hacia abajo que está ubicada al lado derecho de la leyenda del mapa. Fuentes: USGS, OCOF, Pacific Institute\u003c/em>\u003c/span>\u003cbr>\n\u003c!-- iframe plugin v.4.3 wordpress.org/plugins/iframe/ -->\u003cbr>\n\u003ciframe loading=\"lazy\" src=\"https://kqed.carto.com/u/kqednews/builder/13e1ca7c-3df3-4f40-bcd3-8072f22d9e6c/embed\" width=\"100%\" height=\"500\" scrolling=\"yes\" class=\"iframe-class\" frameborder=\"0\">\u003c/iframe>\n\u003c/p>\n\u003cp>El nivel de la marea alta de la bahía se dirige en una dirección: arriba. Los modelos utilizados en \u003ca href=\"http://www.opc.ca.gov/webmaster/ftp/pdf/docs/rising-seas-in-california-an-update-on-sea-level-rise-science.pdf\" target=\"_blank\" rel=\"noopener noreferrer\">la última evaluación\u003c/a> del aumento del nivel del mar del estado de California, en 2017, incluyen un rango superior que está definido en términos de eventos estadísticamente menos probables. Muestran que la bahía podría elevarse hasta 1.9 pies para el año 2050 y 6.9 pies para los fines de siglo, que son mayores que los niveles demostrados en los dos mapas de esta página.\u003c/p>\n\u003cp>Pero esto podría empeorar aún más: las ciudades que ya se están preparando para posibles inundaciones en los próximos años también tienen que preocuparse por unos metros adicionales de agua que se estrellan contra las costas durante una tormenta intensa.\u003c/p>\n\u003cp>Durante las tormentas, East Palo Alto y otras ciudades a lo largo de la costa de la bahía ya sufren inundaciones y erosión costera, que solo se verán agravadas por el esperando aumento del nivel del mar.\u003c/p>\n\u003cp>“El aumento del nivel del mar es uno de los efectos más seguros del cambio climático”, dijo \u003ca href=\"https://ce.berkeley.edu/people/faculty/stacey\" target=\"_blank\" rel=\"noopener noreferrer\">Mark Stacey\u003c/a>, ingeniero ambiental de UC Berkeley. “Sabemos que gran parte de eso ya está fijo, y sabemos que los mares seguirán aumentando a un ritmo constante y quizás acelerándose en las próximas décadas”.\u003c/p>\n\u003cp>Son pocas las diferencias entre los escenarios de modelado científico antes del año 2050 , pero estas cambian drásticamente después de mediados de siglo de acuerdo conla trayectoria de las emisiones de gases de efecto invernadero, lo cual queda en manos de los seres humanos, y el destino de las placas de hielo en Groenlandia y la Antártida.\u003c/p>\n\u003ch5>Una proyección del aumento del nivel del mar en el Área de la Bahía en 2100\u003c/h5>\n\u003cp style=\"line-height: 90%\">\u003cspan style=\"font-size: small\">\u003cem>Puede mover su mouse para explorar las direcciones del mapa. Puede usar los signos (+) y (-) para acercarse o alejarse. Selecciona la lupa para buscar una dirección específica. Para esconder la leyenda, selecciona la flecha hacia abajo que está ubicada al lado derecho de la leyenda del mapa. Fuentes: USGS, OCOF, Pacific Institute\u003c/em>\u003c/span>\u003cbr>\n\u003c!-- iframe plugin v.4.3 wordpress.org/plugins/iframe/ -->\u003cbr>\n\u003ciframe loading=\"lazy\" src=\"https://kqed.carto.com/u/kqednews/builder/6f66d357-18dc-49af-95d7-f34ca39e38b7/embed\" width=\"100%\" height=\"500\" scrolling=\"yes\" class=\"iframe-class\" frameborder=\"0\">\u003c/iframe>\n\u003c/p>\n\u003cp>Los mapas o modelos científicos no cuentan una historia más drástica, en el que las placas de hielo de Groenlandia y la Antártida colapsan. Pero si esto ocurre, el Área de la Bahía podría ver un aumento de 10 pies del nivel del mar para el 2100, lo que Stacey llama una “aceleración masiva” de 30 a 40 veces más rápida que la tasa de aumento que hemos visto durante el último siglo.\u003c/p>\n\u003cp>“Esto se extiende más allá del alcance de lo que hemos pensado en nuestro horizonte de planificación en términos de la magnitud del cambio que enfrentaremos en esta región”, dijo, y agregó que tal aumento requeriría un “replanteamiento completo de la comunidades en todo el Área de la Bahía, y un cambio de sistemas de infraestructura que sería bastante profundo “.\u003c/p>\n\u003cp>La evaluación del estado dice: “Las reducciones agresivas en las emisiones de gases de efecto invernadero pueden reducir sustancialmente, pero no eliminar, el riesgo de un aumento extremo del nivel del mar en California debido a la pérdida de hielo antártico”.\u003c/p>\n\u003cp>\u003cstrong>Fuente de datos\u003c/strong>\u003cbr>\n\u003cem>Las proyecciones para las inundaciones del Área de la Bahía provienen del escenario 8.5 del “sendero de concentración representativa” o representative concentration pathway en inglés del Panel Intergubernamental sobre el Cambio Climático, como se detalla en \u003ca href=\"http://www.opc.ca.gov/webmaster/ftp/pdf/docs/rising-seas-in-california-an-update-on-sea-level-rise-science.pdf\" target=\"_blank\" rel=\"noopener noreferrer\">la última evaluación científica\u003c/a> del aumento del nivel del mar en California, dirigida por Gary Griggs de UC Santa Cruz.\u003c/em>\u003c/p>\n\u003cp>\u003cem>El escenario asume que “no hay esfuerzos globales significativos para limitar o reducir las emisiones”.\u003c/em>\u003c/p>\n\u003cp>\u003cem>Los mapas utilizan un modelo dinámico de \u003ca href=\"http://ourcoastourfuture.org/\" target=\"_blank\" rel=\"noopener noreferrer\">Our Coast, Our Future\u003c/a>. Las inundaciones estimadas son aproximaciones. Los datos provienen del U.S. Geological Survey Coastal Storm Modeling System 9 CoSMoS v2.1; Barnard et al, 2014.\u003c/em>\u003c/p>\n\u003cp>\u003cem>Este artículo fue traducido por la periodista, \u003ca href=\"https://www.kqed.org/author/lblanco\" target=\"_blank\" rel=\"noopener noreferrer\">Lina Blanco\u003c/a> y editado por la periodista \u003ca href=\"https://www.kqed.org/author/amorga\" target=\"_blank\" rel=\"noopener noreferrer\">Adriana Morga\u003c/a>. \u003c/em>\u003c/p>\n\u003cp>\u003c/p>\u003c/div>",
"attributes": {
"named": {},
"numeric": []
}
},
{
"type": "component",
"content": "",
"name": "ad",
"attributes": {
"named": {
"label": "fullwidth"
},
"numeric": [
"fullwidth"
]
}
},
{
"type": "contentString",
"content": "\u003cdiv class=\"post-body\">\u003cp>\u003c/p>\n\u003cp>\u003c/p>\n\u003c/div>\u003c/p>",
"attributes": {
"named": {},
"numeric": []
}
}
],
"link": "/science/1974195/mapa-ver-los-lugares-en-riesgo-de-inundacion-por-el-aumento-del-nivel-del-mar",
"authors": [
"11501",
"11608"
],
"categories": [
"science_31",
"science_35",
"science_40",
"science_2873",
"science_4450"
],
"tags": [
"science_194",
"science_5184",
"science_206"
],
"featImg": "science_1974298",
"label": "source_science_1974195"
},
"science_1973624": {
"type": "posts",
"id": "science_1973624",
"meta": {
"index": "posts_1716263798",
"site": "science",
"id": "1973624",
"score": null,
"sort": [
1619074885000
]
},
"parent": 0,
"labelTerm": {},
"blocks": [],
"publishDate": 1619074885,
"format": "aside",
"title": "Maps: See Which Bay Area Locations Are at Risk From Rising Seas",
"headTitle": "Maps: See Which Bay Area Locations Are at Risk From Rising Seas | KQED",
"content": "\u003cp>\u003cem>This series is part of the Pulitzer Center’s nationwide \u003ca href=\"http://connected-coastlines.pulitzercenter.org/\" target=\"_blank\" rel=\"noopener noreferrer\">Connected Coastlines reporting initiative\u003c/a>.\u003c/em>\u003c/p>\n\u003cp>\u003cem>\u003ca href=\"https://www.kqed.org/science/1974195/mapa-ver-los-lugares-en-riesgo-de-inundacion-por-el-aumento-del-nivel-del-mar\" target=\"_blank\" rel=\"noopener noreferrer\">Leer en español\u003c/a>\u003c/em>\u003c/p>\n\u003ch5>Bay Area 2050 Projected Sea Level Rise\u003c/h5>\n\u003cp style=\"line-height: 90%\">\u003cspan style=\"font-size: small\">\u003cem>Use your mouse to move the map. Click the arrow to view the map legend. Use the + and – signs to zoom in and out. Click on the magnifying glass at the bottom to search for a specific address. Click on the down arrow top right of the legend to remove it. Sources: USGS, OCOF, Pacific Institute\u003c/em>\u003c/span>\u003cbr>\n\u003c!-- iframe plugin v.4.3 wordpress.org/plugins/iframe/ -->\u003cbr>\n\u003ciframe loading=\"lazy\" src=\"https://www.arcgis.com/apps/Embed/index.html?webmap=1f92f63dee1840c3b472fc341d98b11d&extent=-122.3564,37.3627,-121.9818,37.6717&home=true&zoom=true&previewImage=false&scale=true&search=true&searchextent=false&details=true&legend=true&active_panel=legend&disable_scroll=true&theme=light\" width=\"100%\" height=\"500\" scrolling=\"yes\" class=\"iframe-class\" frameborder=\"0\">\u003c/iframe>\n\u003c/p>\n\u003cp>The bay’s high tide level is going in one direction: up. Models used in the state’s latest sea level rise \u003ca href=\"http://www.opc.ca.gov/webmaster/ftp/pdf/docs/rising-seas-in-california-an-update-on-sea-level-rise-science.pdf\" target=\"_blank\" rel=\"noopener noreferrer\">assessment\u003c/a>, from 2017, include an upper range defined in terms of statistically less probable events. They show the bay could rise by up to 1.9 feet by the year 2050 and 6.9 feet by the end of the century, which are greater than the levels shown in the two maps on this page.\u003c/p>\n\u003cp>But it could get even worse: Cities preparing for future flooding also have to worry about several additional feet of water crashing against their shorelines during a bad storm.\u003c/p>\n\u003cp>Already during storms, East Palo Alto and other cities along the shoreline experience coastal flooding and erosion, which will only be exacerbated by the coming rise in sea level.\u003c/p>\n\u003cp>“Rising seas is one of the most certain of the effects of climate change,” said \u003ca href=\"https://ce.berkeley.edu/people/faculty/stacey\">Mark Stacey\u003c/a>, a UC Berkeley environmental engineer. “We know much of that is already baked in, and we know the seas are going to continue to rise at pace and perhaps accelerate in the coming decades.\u003c/p>\n\u003cp>Differences in scientific modeling scenarios before the year 2050 are minor, but they diverge significantly after mid-century depending on the trajectory of greenhouse gas emissions, which human beings will determine, and the fate of ice sheets in Greenland and Antarctica.\u003c/p>\n\u003ch5>Bay Area 2100 Projected Sea Level Rise\u003c/h5>\n\u003cp style=\"line-height: 90%\">\u003cspan style=\"font-size: small\">\u003cem>Use your mouse to move different directions on the map. Use the + and – signs to zoom in and out. Click on the magnifying glass at the bottom to search for a specific address. Click on the down arrow top right of the legend to remove it. Sources: USGS, OCOF, Pacific Institute\u003c/em>\u003c/span>\u003cbr>\n\u003c!-- iframe plugin v.4.3 wordpress.org/plugins/iframe/ -->\u003cbr>\n\u003ciframe loading=\"lazy\" src=\"https://www.arcgis.com/apps/Embed/index.html?webmap=64c2754019244ff7ae2ac93f22843366&extent=-122.3832,37.3647,-121.9633,37.6737&home=true&zoom=true&previewImage=false&scale=true&search=true&searchextent=false&details=true&legendlayers=true&active_panel=legend&disable_scroll=true&theme=light\" width=\"100%\" height=\"500\" scrolling=\"yes\" class=\"iframe-class\" frameborder=\"0\">\u003c/iframe>\n\u003c/p>\n\u003cp>These models don’t incorporate a more extreme scenario, in which ice sheets in Greenland and Antarctica collapse. If this occurs, the Bay Area could see 10 feet of sea level rise by 2100 — what Stacey calls a “massive acceleration” that’s 30 to 40 times faster than the rate of increase we’ve experienced over the last century.\u003c/p>\n\u003cp>“This goes beyond the scope of what we’ve thought about in planning horizons in terms of the magnitude of change that we’d be facing as a region,” he said, adding that such an increase would require a “complete rethinking of the community surrounding the entire Bay Area, and a move of infrastructure systems that would be pretty profound.”\u003c/p>\n\u003cp>The state’s assessment says: “Aggressive reductions in greenhouse gas emissions may substantially reduce but do not eliminate the risk to California of extreme sea-level rise from Antarctic ice loss.”\u003c/p>\n\u003cp>\u003cstrong>Data Sources\u003c/strong>\u003c/p>\n\u003cp>\u003cem>Projections for Bay Area flooding are from the Intergovernmental Panel on Climate Change “representative concentration pathway” 8.5 scenario as detailed in California’s latest sea level rise science \u003ca href=\"http://www.opc.ca.gov/webmaster/ftp/pdf/docs/rising-seas-in-california-an-update-on-sea-level-rise-science.pdf\" target=\"_blank\" rel=\"noopener noreferrer\">assessment\u003c/a>, led by Gary Griggs from UC Santa Cruz.\u003c/em>\u003c/p>\n\u003cp>\u003cem>The scenario assumes “there are no significant global efforts to limit or reduce emissions.”\u003c/em>\u003c/p>\n\u003cp>\u003cem>The maps uses a dynamic computer model from \u003ca href=\"http://ourcoastourfuture.org/\">Our\u003c/a> \u003ca href=\"http://ourcoastourfuture.org/\">Coast\u003c/a>\u003ca href=\"http://ourcoastourfuture.org/\">, \u003c/a>\u003ca href=\"http://ourcoastourfuture.org/\">Our\u003c/a> \u003ca href=\"http://ourcoastourfuture.org/\">Future\u003c/a>. Flood estimates are approximations. Data are from the U.S. Geological Survey Coastal Storm Modeling System 9 CoSMoS v2.1; Barnard et al, 2014.\u003c/em>\u003c/p>\n\u003cp>[ad fullwidth]\u003c/p>\n\u003cp>\u003c/p>\n",
"stats": {
"hasVideo": false,
"hasChartOrMap": true,
"hasAudio": false,
"hasPolis": false,
"wordCount": 638,
"hasGoogleForm": false,
"hasGallery": false,
"hasHearkenModule": false,
"iframeSrcs": [
"https://www.arcgis.com/apps/Embed/index.html"
],
"paragraphCount": 16
},
"modified": 1704846663,
"excerpt": "The bay’s high tide level is going in one direction: up. See where rising seas are projected to encroach on Bay Area shorelines by 2050 and 2100.",
"headData": {
"twImgId": "",
"twTitle": "",
"ogTitle": "",
"ogImgId": "",
"twDescription": "",
"description": "The bay’s high tide level is going in one direction: up. See where rising seas are projected to encroach on Bay Area shorelines by 2050 and 2100.",
"title": "Maps: See Which Bay Area Locations Are at Risk From Rising Seas | KQED",
"ogDescription": "",
"schema": {
"@context": "https://schema.org",
"@type": "Article",
"headline": "Maps: See Which Bay Area Locations Are at Risk From Rising Seas",
"datePublished": "2021-04-22T00:01:25-07:00",
"dateModified": "2024-01-09T16:31:03-08:00",
"image": "https://cdn.kqed.org/wp-content/uploads/2020/02/KQED-OG-Image@1x.png"
}
},
"guestAuthors": [],
"slug": "maps-see-which-bay-area-locations-are-at-risk-from-rising-seas",
"status": "publish",
"excludeFromSiteSearch": "Include",
"sticky": false,
"source": "Sea Level Rise",
"articleAge": "0",
"path": "/science/1973624/maps-see-which-bay-area-locations-are-at-risk-from-rising-seas",
"audioTrackLength": null,
"parsedContent": [
{
"type": "contentString",
"content": "\u003cdiv class=\"post-body\">\u003cp>\u003cp>\u003cem>This series is part of the Pulitzer Center’s nationwide \u003ca href=\"http://connected-coastlines.pulitzercenter.org/\" target=\"_blank\" rel=\"noopener noreferrer\">Connected Coastlines reporting initiative\u003c/a>.\u003c/em>\u003c/p>\n\u003cp>\u003cem>\u003ca href=\"https://www.kqed.org/science/1974195/mapa-ver-los-lugares-en-riesgo-de-inundacion-por-el-aumento-del-nivel-del-mar\" target=\"_blank\" rel=\"noopener noreferrer\">Leer en español\u003c/a>\u003c/em>\u003c/p>\n\u003ch5>Bay Area 2050 Projected Sea Level Rise\u003c/h5>\n\u003cp style=\"line-height: 90%\">\u003cspan style=\"font-size: small\">\u003cem>Use your mouse to move the map. Click the arrow to view the map legend. Use the + and – signs to zoom in and out. Click on the magnifying glass at the bottom to search for a specific address. Click on the down arrow top right of the legend to remove it. Sources: USGS, OCOF, Pacific Institute\u003c/em>\u003c/span>\u003cbr>\n\u003c!-- iframe plugin v.4.3 wordpress.org/plugins/iframe/ -->\u003cbr>\n\u003ciframe loading=\"lazy\" src=\"https://www.arcgis.com/apps/Embed/index.html?webmap=1f92f63dee1840c3b472fc341d98b11d&extent=-122.3564,37.3627,-121.9818,37.6717&home=true&zoom=true&previewImage=false&scale=true&search=true&searchextent=false&details=true&legend=true&active_panel=legend&disable_scroll=true&theme=light\" width=\"100%\" height=\"500\" scrolling=\"yes\" class=\"iframe-class\" frameborder=\"0\">\u003c/iframe>\n\u003c/p>\n\u003cp>The bay’s high tide level is going in one direction: up. Models used in the state’s latest sea level rise \u003ca href=\"http://www.opc.ca.gov/webmaster/ftp/pdf/docs/rising-seas-in-california-an-update-on-sea-level-rise-science.pdf\" target=\"_blank\" rel=\"noopener noreferrer\">assessment\u003c/a>, from 2017, include an upper range defined in terms of statistically less probable events. They show the bay could rise by up to 1.9 feet by the year 2050 and 6.9 feet by the end of the century, which are greater than the levels shown in the two maps on this page.\u003c/p>\n\u003cp>But it could get even worse: Cities preparing for future flooding also have to worry about several additional feet of water crashing against their shorelines during a bad storm.\u003c/p>\n\u003cp>Already during storms, East Palo Alto and other cities along the shoreline experience coastal flooding and erosion, which will only be exacerbated by the coming rise in sea level.\u003c/p>\n\u003cp>“Rising seas is one of the most certain of the effects of climate change,” said \u003ca href=\"https://ce.berkeley.edu/people/faculty/stacey\">Mark Stacey\u003c/a>, a UC Berkeley environmental engineer. “We know much of that is already baked in, and we know the seas are going to continue to rise at pace and perhaps accelerate in the coming decades.\u003c/p>\n\u003cp>Differences in scientific modeling scenarios before the year 2050 are minor, but they diverge significantly after mid-century depending on the trajectory of greenhouse gas emissions, which human beings will determine, and the fate of ice sheets in Greenland and Antarctica.\u003c/p>\n\u003ch5>Bay Area 2100 Projected Sea Level Rise\u003c/h5>\n\u003cp style=\"line-height: 90%\">\u003cspan style=\"font-size: small\">\u003cem>Use your mouse to move different directions on the map. Use the + and – signs to zoom in and out. Click on the magnifying glass at the bottom to search for a specific address. Click on the down arrow top right of the legend to remove it. Sources: USGS, OCOF, Pacific Institute\u003c/em>\u003c/span>\u003cbr>\n\u003c!-- iframe plugin v.4.3 wordpress.org/plugins/iframe/ -->\u003cbr>\n\u003ciframe loading=\"lazy\" src=\"https://www.arcgis.com/apps/Embed/index.html?webmap=64c2754019244ff7ae2ac93f22843366&extent=-122.3832,37.3647,-121.9633,37.6737&home=true&zoom=true&previewImage=false&scale=true&search=true&searchextent=false&details=true&legendlayers=true&active_panel=legend&disable_scroll=true&theme=light\" width=\"100%\" height=\"500\" scrolling=\"yes\" class=\"iframe-class\" frameborder=\"0\">\u003c/iframe>\n\u003c/p>\n\u003cp>These models don’t incorporate a more extreme scenario, in which ice sheets in Greenland and Antarctica collapse. If this occurs, the Bay Area could see 10 feet of sea level rise by 2100 — what Stacey calls a “massive acceleration” that’s 30 to 40 times faster than the rate of increase we’ve experienced over the last century.\u003c/p>\n\u003cp>“This goes beyond the scope of what we’ve thought about in planning horizons in terms of the magnitude of change that we’d be facing as a region,” he said, adding that such an increase would require a “complete rethinking of the community surrounding the entire Bay Area, and a move of infrastructure systems that would be pretty profound.”\u003c/p>\n\u003cp>The state’s assessment says: “Aggressive reductions in greenhouse gas emissions may substantially reduce but do not eliminate the risk to California of extreme sea-level rise from Antarctic ice loss.”\u003c/p>\n\u003cp>\u003cstrong>Data Sources\u003c/strong>\u003c/p>\n\u003cp>\u003cem>Projections for Bay Area flooding are from the Intergovernmental Panel on Climate Change “representative concentration pathway” 8.5 scenario as detailed in California’s latest sea level rise science \u003ca href=\"http://www.opc.ca.gov/webmaster/ftp/pdf/docs/rising-seas-in-california-an-update-on-sea-level-rise-science.pdf\" target=\"_blank\" rel=\"noopener noreferrer\">assessment\u003c/a>, led by Gary Griggs from UC Santa Cruz.\u003c/em>\u003c/p>\n\u003cp>\u003cem>The scenario assumes “there are no significant global efforts to limit or reduce emissions.”\u003c/em>\u003c/p>\n\u003cp>\u003cem>The maps uses a dynamic computer model from \u003ca href=\"http://ourcoastourfuture.org/\">Our\u003c/a> \u003ca href=\"http://ourcoastourfuture.org/\">Coast\u003c/a>\u003ca href=\"http://ourcoastourfuture.org/\">, \u003c/a>\u003ca href=\"http://ourcoastourfuture.org/\">Our\u003c/a> \u003ca href=\"http://ourcoastourfuture.org/\">Future\u003c/a>. Flood estimates are approximations. Data are from the U.S. Geological Survey Coastal Storm Modeling System 9 CoSMoS v2.1; Barnard et al, 2014.\u003c/em>\u003c/p>\n\u003cp>\u003c/p>\u003c/div>",
"attributes": {
"named": {},
"numeric": []
}
},
{
"type": "component",
"content": "",
"name": "ad",
"attributes": {
"named": {
"label": "fullwidth"
},
"numeric": [
"fullwidth"
]
}
},
{
"type": "contentString",
"content": "\u003cdiv class=\"post-body\">\u003cp>\u003c/p>\n\u003cp>\u003c/p>\n\u003c/div>\u003c/p>",
"attributes": {
"named": {},
"numeric": []
}
}
],
"link": "/science/1973624/maps-see-which-bay-area-locations-are-at-risk-from-rising-seas",
"authors": [
"11501",
"11608"
],
"categories": [
"science_31",
"science_35",
"science_40",
"science_2873",
"science_4450"
],
"tags": [
"science_194",
"science_206"
],
"featImg": "science_1984386",
"label": "source_science_1973624"
},
"science_1966305": {
"type": "posts",
"id": "science_1966305",
"meta": {
"index": "posts_1716263798",
"site": "science",
"id": "1966305",
"score": null,
"sort": [
1593545235000
]
},
"parent": 0,
"labelTerm": {},
"blocks": [],
"publishDate": 1593545235,
"format": "aside",
"title": "QUIZ: Planning a Summer Trip to Visit Family? Check Your COVID-19 Travel Risk",
"headTitle": "QUIZ: Planning a Summer Trip to Visit Family? Check Your COVID-19 Travel Risk | KQED",
"content": "\u003cp>\u003ca href=\"https://www.kqed.org/science/1967134/planeas-visitar-a-tu-familia-este-verano-haz-este-quiz-para-medir-los-riesgos-de-viajar-en-tiempos-de-covid-19\">\u003cem>Leer en español\u003c/em>\u003c/a>.\u003c/p>\n\u003cp>\u003c!-- iframe plugin v.4.3 wordpress.org/plugins/iframe/ -->\u003cbr>\n\u003ciframe loading=\"lazy\" src=\"https://www.qzzr.com/c/quiz/477732/visiting-relatives-during-covid-19\" width=\"100%\" height=\"750\" scrolling=\"yes\" class=\"iframe-class\" frameborder=\"0\">\u003c/iframe>\u003c/p>\n\u003cp>[ad fullwidth]\u003c/p>\u003cp>\u003c/p>\n",
"stats": {
"hasVideo": false,
"hasChartOrMap": true,
"hasAudio": false,
"hasPolis": false,
"wordCount": 7,
"hasGoogleForm": false,
"hasGallery": false,
"hasHearkenModule": false,
"iframeSrcs": [
"https://www.qzzr.com/c/quiz/477732/visiting-relatives-during-covid-19"
],
"paragraphCount": 4
},
"modified": 1704847251,
"excerpt": "Considering a trip to visit relatives or loved ones this summer? We created this quiz to help you check your risk level and take steps to minimize it.",
"headData": {
"twImgId": "",
"twTitle": "",
"ogTitle": "",
"ogImgId": "",
"twDescription": "",
"description": "Considering a trip to visit relatives or loved ones this summer? We created this quiz to help you check your risk level and take steps to minimize it.",
"title": "QUIZ: Planning a Summer Trip to Visit Family? Check Your COVID-19 Travel Risk | KQED",
"ogDescription": "",
"schema": {
"@context": "https://schema.org",
"@type": "Article",
"headline": "QUIZ: Planning a Summer Trip to Visit Family? Check Your COVID-19 Travel Risk",
"datePublished": "2020-06-30T12:27:15-07:00",
"dateModified": "2024-01-09T16:40:51-08:00",
"image": "https://cdn.kqed.org/wp-content/uploads/2020/02/KQED-OG-Image@1x.png"
}
},
"guestAuthors": [],
"slug": "quiz-planning-a-summer-trip-to-visit-family-check-your-covid-19-travel-risk",
"status": "publish",
"sticky": false,
"source": "Coronavirus",
"path": "/science/1966305/quiz-planning-a-summer-trip-to-visit-family-check-your-covid-19-travel-risk",
"audioTrackLength": null,
"parsedContent": [
{
"type": "contentString",
"content": "\u003cdiv class=\"post-body\">\u003cp>\u003cp>\u003ca href=\"https://www.kqed.org/science/1967134/planeas-visitar-a-tu-familia-este-verano-haz-este-quiz-para-medir-los-riesgos-de-viajar-en-tiempos-de-covid-19\">\u003cem>Leer en español\u003c/em>\u003c/a>.\u003c/p>\n\u003cp>\u003c!-- iframe plugin v.4.3 wordpress.org/plugins/iframe/ -->\u003cbr>\n\u003ciframe loading=\"lazy\" src=\"https://www.qzzr.com/c/quiz/477732/visiting-relatives-during-covid-19\" width=\"100%\" height=\"750\" scrolling=\"yes\" class=\"iframe-class\" frameborder=\"0\">\u003c/iframe>\u003c/p>\n\u003cp>\u003c/p>\u003c/div>",
"attributes": {
"named": {},
"numeric": []
}
},
{
"type": "component",
"content": "",
"name": "ad",
"attributes": {
"named": {
"label": "fullwidth"
},
"numeric": [
"fullwidth"
]
}
},
{
"type": "contentString",
"content": "\u003cdiv class=\"post-body\">\u003cp>\u003c/p>\u003cp>\u003c/p>\n\u003c/div>\u003c/p>",
"attributes": {
"named": {},
"numeric": []
}
}
],
"link": "/science/1966305/quiz-planning-a-summer-trip-to-visit-family-check-your-covid-19-travel-risk",
"authors": [
"11368",
"11501"
],
"categories": [
"science_39",
"science_3890",
"science_40",
"science_4450"
],
"tags": [
"science_4329",
"science_4368"
],
"featImg": "science_1966628",
"label": "source_science_1966305"
},
"science_1964968": {
"type": "posts",
"id": "science_1964968",
"meta": {
"index": "posts_1716263798",
"site": "science",
"id": "1964968",
"score": null,
"sort": [
1591992956000
]
},
"parent": 0,
"labelTerm": {},
"blocks": [],
"publishDate": 1591992956,
"format": "aside",
"title": "CHARTS: Here Are the Trendlines for COVID-19 Deaths and Hospitalizations in Each Bay Area County",
"headTitle": "CHARTS: Here Are the Trendlines for COVID-19 Deaths and Hospitalizations in Each Bay Area County | KQED",
"content": "\u003cp>This post is no longer being updated. Please see the state’s \u003ca href=\"https://covid19.ca.gov/state-dashboard/\" target=\"_blank\" rel=\"noopener noreferrer\">COVID-19 data dashboard\u003c/a> for the latest statistics on cases, deaths and other metrics. The San Francisco Chronicle also maintains a \u003ca href=\"https://www.sfchronicle.com/projects/coronavirus-map/\" target=\"_blank\" rel=\"noopener noreferrer\">coronavirus tracker\u003c/a> covering statistics for the Bay Area and the state.\u003c/p>\n\u003cp>[ad fullwidth]\u003c/p>\u003cp>\u003c/p>\n",
"stats": {
"hasVideo": false,
"hasChartOrMap": false,
"hasAudio": false,
"hasPolis": false,
"wordCount": 47,
"hasGoogleForm": false,
"hasGallery": false,
"hasHearkenModule": false,
"iframeSrcs": [],
"paragraphCount": 3
},
"modified": 1704847305,
"excerpt": "As policymakers calibrate and recalibrate what is allowed to open, they are looking closely at a suite of metrics.",
"headData": {
"twImgId": "",
"twTitle": "",
"ogTitle": "",
"ogImgId": "",
"twDescription": "",
"description": "As policymakers calibrate and recalibrate what is allowed to open, they are looking closely at a suite of metrics.",
"title": "CHARTS: Here Are the Trendlines for COVID-19 Deaths and Hospitalizations in Each Bay Area County | KQED",
"ogDescription": "",
"schema": {
"@context": "https://schema.org",
"@type": "Article",
"headline": "CHARTS: Here Are the Trendlines for COVID-19 Deaths and Hospitalizations in Each Bay Area County",
"datePublished": "2020-06-12T13:15:56-07:00",
"dateModified": "2024-01-09T16:41:45-08:00",
"image": "https://cdn.kqed.org/wp-content/uploads/2020/02/KQED-OG-Image@1x.png"
}
},
"guestAuthors": [],
"slug": "charts-the-bay-area-is-opening-up-again-heres-tracking-data-for-each-county-to-see-how-its-going",
"status": "publish",
"sticky": false,
"source": "Coronavirus",
"path": "/science/1964968/charts-the-bay-area-is-opening-up-again-heres-tracking-data-for-each-county-to-see-how-its-going",
"audioTrackLength": null,
"parsedContent": [
{
"type": "contentString",
"content": "\u003cdiv class=\"post-body\">\u003cp>\u003cp>This post is no longer being updated. Please see the state’s \u003ca href=\"https://covid19.ca.gov/state-dashboard/\" target=\"_blank\" rel=\"noopener noreferrer\">COVID-19 data dashboard\u003c/a> for the latest statistics on cases, deaths and other metrics. The San Francisco Chronicle also maintains a \u003ca href=\"https://www.sfchronicle.com/projects/coronavirus-map/\" target=\"_blank\" rel=\"noopener noreferrer\">coronavirus tracker\u003c/a> covering statistics for the Bay Area and the state.\u003c/p>\n\u003cp>\u003c/p>\u003c/div>",
"attributes": {
"named": {},
"numeric": []
}
},
{
"type": "component",
"content": "",
"name": "ad",
"attributes": {
"named": {
"label": "fullwidth"
},
"numeric": [
"fullwidth"
]
}
},
{
"type": "contentString",
"content": "\u003cdiv class=\"post-body\">\u003cp>\u003c/p>\u003cp>\u003c/p>\n\u003c/div>\u003c/p>",
"attributes": {
"named": {},
"numeric": []
}
}
],
"link": "/science/1964968/charts-the-bay-area-is-opening-up-again-heres-tracking-data-for-each-county-to-see-how-its-going",
"authors": [
"11501",
"80",
"199"
],
"categories": [
"science_39",
"science_3890",
"science_4450"
],
"tags": [
"science_4329",
"science_4414"
],
"featImg": "science_1972037",
"label": "source_science_1964968"
},
"science_1965221": {
"type": "posts",
"id": "science_1965221",
"meta": {
"index": "posts_1716263798",
"site": "science",
"id": "1965221",
"score": null,
"sort": [
1591221025000
]
},
"parent": 0,
"labelTerm": {},
"blocks": [],
"publishDate": 1591221025,
"format": "aside",
"title": "MAP: See Which Bay Area Nursing Homes and Long-term Care Facilities Have Had Coronavirus Outbreaks",
"headTitle": "MAP: See Which Bay Area Nursing Homes and Long-term Care Facilities Have Had Coronavirus Outbreaks | KQED",
"content": "\u003cp class=\"p1\">In the Bay Area alone, 97 skilled nursing facilities and 18 residential care homes for the elderly have reported outbreaks of COVID-19, part of a\u003ca href=\"https://www.npr.org/sections/coronavirus-live-updates/2020/06/01/867492962/nearly-26-000-nursing-home-residents-have-died-from-covid-19-federal-data-show\" target=\"_blank\" rel=\"noopener noreferrer\"> national trend\u003c/a> that has seen the coronavirus taking a heavy toll on the frail and elderly, and creating stress and anxiety for their loved ones. You can see which Bay Area facilities have reported infections in the map below. Scroll over each one to see the extent of the outbreak, which or may not be current, through the month of May.\u003c/p>\n\u003cp>\u003c!-- iframe plugin v.4.3 wordpress.org/plugins/iframe/ -->\u003cbr>\n\u003ciframe loading=\"lazy\" src=\"https://kqednews.carto.com/builder/474f54c3-f879-4d5a-addb-5679f4b4927a/embed%22%20allowfullscreen%20webkitallowfullscreen%20mozallowfullscreen%20oallowfullscreen%20msallowfullscreen\" width=\"100%\" height=\"500\" scrolling=\"yes\" class=\"iframe-class\" frameborder=\"0\">\u003c/iframe>\u003c/p>\n\u003cp class=\"p1\">Statewide, as of May 31, at least 2,184 residents and staff of nursing homes and assisted living facilities have died of COVID-19, according to data reported by the \u003cspan class=\"s1\">California Department o\u003c/span>\u003cspan class=\"s1\">f\u003c/span>\u003cspan class=\"s1\"> Public Health\u003c/span> and the \u003cspan class=\"s1\">California Department of Social Services\u003c/span>. That total makes up around half of the state’s coronavirus deaths.\u003c/p>\n\u003cp>\u003cem>\u003ca href=\"#callout\">Click here if you know someone in a nursing home or assisted facility … share your story!\u003c/a>\u003c/em>\u003c/p>\n\u003cp class=\"p1\">State health officials have acknowledged that published case and death totals are less than exact. COVID-19 cases and deaths are self-reported by facility representatives, and regulators do not systematically verify them. Where facilities report under 11 infections or related deaths, the totals are reported as “10 or fewer,” a practice the agencies say is necessary in order to protect patient privacy.\u003c/p>\n\u003cp class=\"p1\">Nursing homes are medical facilities overseen by the Department of Public Health, while assisted living facilities are managed by the Department of Social Services. CDPH has recently created a \u003ca href=\"https://www.cdph.ca.gov/Programs/CID/DCDC/Pages/COVID-19/SNFsCOVID_19.aspx\" target=\"_blank\" rel=\"noopener noreferrer\">\u003cspan class=\"s1\">dashboard\u003c/span>\u003c/a> with all outbreaks in nursing homes across the state, including both a daily snapshot and cumulative totals. The CDSS data is harder to track; the agency \u003cspan class=\"s1\">shares \u003c/span>\u003ca href=\"https://www.cdss.ca.gov/inforesources/research-and-data\" target=\"_blank\" rel=\"noopener noreferrer\">daily reports\u003c/a> about outbreaks in assisted living facilities housing more than six patients in a PDF file on its website.\u003c/p>\n\u003cp class=\"p1\">Advocates for residents in long-term care facilities have been concerned about a lack of transparency around coronavirus outbreaks and management since the beginning of the pandemic. Charlene Harrington, professor emeritus at UCSF and an expert on long-term care, says the data has been inconsistent. \u003ci>“\u003c/i>I’d like to see [CDPH] do a better job with oversight,” she says. “And trying to verify what’s going on in the nursing homes, not just letting nursing homes self report.”\u003c/p>\n\u003cp class=\"p1\">Both CDPH and CDSS say they’re in close contact with all facilities via televisits and in-person inspections to verify some of the reported outbreak numbers.\u003c/p>\n\u003cp class=\"p1\">Federal and state regulators offer guidelines, which include testing and infection control, for dealing with COVID-19 in nursing homes. Some guidelines also apply to assisted living facilities. County health departments don’t regulate long-term care homes, but many offer guidelines to both skilled nursing and assisted living facilities.\u003c/p>\n\u003cp class=\"p1\">Pat McGinnis, executive director of California Advocates for Nursing Home Reform, says that families of residents in long-term care facilities with coronavirus outbreaks should be in contact with those facilities to ensure their loved ones are safe. Here are some questions she suggests asking:\u003c/p>\n\u003cul>\n\u003cli>\u003cem>Testing\u003c/em>\n\u003cul>\n\u003cli>Have all residents and staff been tested?\u003c/li>\n\u003cli>How often are tests given?\u003c/li>\n\u003c/ul>\n\u003c/li>\n\u003cli>\u003cem>Isolation of positive cases\u003c/em>\n\u003cul>\n\u003cli>How is the facility keeping residents who do not have the virus safe from those who do?\u003c/li>\n\u003c/ul>\n\u003c/li>\n\u003cli>\u003cem>Infection control\u003c/em>\n\u003cul>\n\u003cli>Who is the \u003ca href=\"https://apic.org/monthly_alerts/who-are-infection-preventionists/\" target=\"_blank\" rel=\"noopener noreferrer\">infection preventionist\u003c/a>?\u003c/li>\n\u003cli>What changes have been made in the facility to enhance infection prevention?\u003c/li>\n\u003cli>How is the facility monitoring to ensure staff are consistently following infection control standards?\u003c/li>\n\u003c/ul>\n\u003c/li>\n\u003cli>\u003cem>Staffing\u003c/em>\n\u003cul>\n\u003cli>How many staff members are in quarantine?\u003c/li>\n\u003cli>Who is replacing them?\u003c/li>\n\u003cli>Are replacement staff qualified?\u003c/li>\n\u003cli>How do staffing levels now compare to levels before the outbreak?\u003c/li>\n\u003cli>Does the facility have extra staff assigned to replace the care and support visitors provided before the lockdown?\u003c/li>\n\u003c/ul>\n\u003c/li>\n\u003cli>\u003cem>Communication with families\u003c/em>\n\u003cul>\n\u003cli>Who is assigned to keep families updated on an outbreak and what is the facility is doing to fight it?\u003c/li>\n\u003cli>How can families contact this person or persons to seek information or share concerns?\u003c/li>\n\u003cli>By what means and how often will facilities communicate with families?\u003c/li>\n\u003c/ul>\n\u003c/li>\n\u003cli>\u003cem>Visitation\u003c/em>\n\u003cul>\n\u003cli>What is the facility doing to help residents stay in frequent contact with residents or patients via telephone, video visits, window visits and other means?\u003c/li>\n\u003c/ul>\n\u003c/li>\n\u003c/ul>\n\u003cp>If you have a complaint or concern about the care of a loved one in a long-term care facility, you can reach out to a \u003ca href=\"https://www.aging.ca.gov/Find_Services_in_My_County/\" target=\"_blank\" rel=\"noopener noreferrer\">\u003cspan class=\"s1\">local ombudsman\u003c/span>\u003c/a> for assistance. The long-term care ombudsmen are representatives from the California Department of Aging who help residents and their families with issues related to day-to-day care, health, and safety.\u003c/p>\n\u003cp> \u003c/p>\n\u003ch3>Help KQED Science report on the pandemic …\u003c/h3>\n\u003cp>[hearken src=\"https://modules.wearehearken.com/kqed/embed/5489.js\"]\u003c/p>\n\u003cp>[ad fullwidth]\u003c/p>\n\u003cp>\u003c/p>\n",
"stats": {
"hasVideo": false,
"hasChartOrMap": true,
"hasAudio": false,
"hasPolis": false,
"wordCount": 777,
"hasGoogleForm": false,
"hasGallery": false,
"hasHearkenModule": true,
"iframeSrcs": [
"https://kqednews.carto.com/builder/474f54c3-f879-4d5a-addb-5679f4b4927a/embed%22%20allowfullscreen%20webkitallowfullscreen%20mozallowfullscreen%20oallowfullscreen%20msallowfullscreen"
],
"paragraphCount": 6
},
"modified": 1704847334,
"excerpt": "In the Bay Area alone, 97 skilled nursing facilities and 18 residential care homes for the elderly have reported outbreaks of COVID-19 through the month of May. See which ones in an interactive map. ",
"headData": {
"twImgId": "",
"twTitle": "",
"ogTitle": "",
"ogImgId": "",
"twDescription": "",
"description": "In the Bay Area alone, 97 skilled nursing facilities and 18 residential care homes for the elderly have reported outbreaks of COVID-19 through the month of May. See which ones in an interactive map. ",
"title": "MAP: See Which Bay Area Nursing Homes and Long-term Care Facilities Have Had Coronavirus Outbreaks | KQED",
"ogDescription": "",
"schema": {
"@context": "https://schema.org",
"@type": "Article",
"headline": "MAP: See Which Bay Area Nursing Homes and Long-term Care Facilities Have Had Coronavirus Outbreaks",
"datePublished": "2020-06-03T14:50:25-07:00",
"dateModified": "2024-01-09T16:42:14-08:00",
"image": "https://cdn.kqed.org/wp-content/uploads/2020/02/KQED-OG-Image@1x.png"
}
},
"guestAuthors": [],
"slug": "map-see-which-bay-area-nursing-homes-and-long-term-care-facilities-have-had-coronavirus-outbreaks",
"status": "publish",
"sticky": false,
"source": "Coronavirus",
"path": "/science/1965221/map-see-which-bay-area-nursing-homes-and-long-term-care-facilities-have-had-coronavirus-outbreaks",
"audioTrackLength": null,
"parsedContent": [
{
"type": "contentString",
"content": "\u003cdiv class=\"post-body\">\u003cp>\u003cp class=\"p1\">In the Bay Area alone, 97 skilled nursing facilities and 18 residential care homes for the elderly have reported outbreaks of COVID-19, part of a\u003ca href=\"https://www.npr.org/sections/coronavirus-live-updates/2020/06/01/867492962/nearly-26-000-nursing-home-residents-have-died-from-covid-19-federal-data-show\" target=\"_blank\" rel=\"noopener noreferrer\"> national trend\u003c/a> that has seen the coronavirus taking a heavy toll on the frail and elderly, and creating stress and anxiety for their loved ones. You can see which Bay Area facilities have reported infections in the map below. Scroll over each one to see the extent of the outbreak, which or may not be current, through the month of May.\u003c/p>\n\u003cp>\u003c!-- iframe plugin v.4.3 wordpress.org/plugins/iframe/ -->\u003cbr>\n\u003ciframe loading=\"lazy\" src=\"https://kqednews.carto.com/builder/474f54c3-f879-4d5a-addb-5679f4b4927a/embed%22%20allowfullscreen%20webkitallowfullscreen%20mozallowfullscreen%20oallowfullscreen%20msallowfullscreen\" width=\"100%\" height=\"500\" scrolling=\"yes\" class=\"iframe-class\" frameborder=\"0\">\u003c/iframe>\u003c/p>\n\u003cp class=\"p1\">Statewide, as of May 31, at least 2,184 residents and staff of nursing homes and assisted living facilities have died of COVID-19, according to data reported by the \u003cspan class=\"s1\">California Department o\u003c/span>\u003cspan class=\"s1\">f\u003c/span>\u003cspan class=\"s1\"> Public Health\u003c/span> and the \u003cspan class=\"s1\">California Department of Social Services\u003c/span>. That total makes up around half of the state’s coronavirus deaths.\u003c/p>\n\u003cp>\u003cem>\u003ca href=\"#callout\">Click here if you know someone in a nursing home or assisted facility … share your story!\u003c/a>\u003c/em>\u003c/p>\n\u003cp class=\"p1\">State health officials have acknowledged that published case and death totals are less than exact. COVID-19 cases and deaths are self-reported by facility representatives, and regulators do not systematically verify them. Where facilities report under 11 infections or related deaths, the totals are reported as “10 or fewer,” a practice the agencies say is necessary in order to protect patient privacy.\u003c/p>\n\u003cp class=\"p1\">Nursing homes are medical facilities overseen by the Department of Public Health, while assisted living facilities are managed by the Department of Social Services. CDPH has recently created a \u003ca href=\"https://www.cdph.ca.gov/Programs/CID/DCDC/Pages/COVID-19/SNFsCOVID_19.aspx\" target=\"_blank\" rel=\"noopener noreferrer\">\u003cspan class=\"s1\">dashboard\u003c/span>\u003c/a> with all outbreaks in nursing homes across the state, including both a daily snapshot and cumulative totals. The CDSS data is harder to track; the agency \u003cspan class=\"s1\">shares \u003c/span>\u003ca href=\"https://www.cdss.ca.gov/inforesources/research-and-data\" target=\"_blank\" rel=\"noopener noreferrer\">daily reports\u003c/a> about outbreaks in assisted living facilities housing more than six patients in a PDF file on its website.\u003c/p>\n\u003cp class=\"p1\">Advocates for residents in long-term care facilities have been concerned about a lack of transparency around coronavirus outbreaks and management since the beginning of the pandemic. Charlene Harrington, professor emeritus at UCSF and an expert on long-term care, says the data has been inconsistent. \u003ci>“\u003c/i>I’d like to see [CDPH] do a better job with oversight,” she says. “And trying to verify what’s going on in the nursing homes, not just letting nursing homes self report.”\u003c/p>\n\u003cp class=\"p1\">Both CDPH and CDSS say they’re in close contact with all facilities via televisits and in-person inspections to verify some of the reported outbreak numbers.\u003c/p>\n\u003cp class=\"p1\">Federal and state regulators offer guidelines, which include testing and infection control, for dealing with COVID-19 in nursing homes. Some guidelines also apply to assisted living facilities. County health departments don’t regulate long-term care homes, but many offer guidelines to both skilled nursing and assisted living facilities.\u003c/p>\n\u003cp class=\"p1\">Pat McGinnis, executive director of California Advocates for Nursing Home Reform, says that families of residents in long-term care facilities with coronavirus outbreaks should be in contact with those facilities to ensure their loved ones are safe. Here are some questions she suggests asking:\u003c/p>\n\u003cul>\n\u003cli>\u003cem>Testing\u003c/em>\n\u003cul>\n\u003cli>Have all residents and staff been tested?\u003c/li>\n\u003cli>How often are tests given?\u003c/li>\n\u003c/ul>\n\u003c/li>\n\u003cli>\u003cem>Isolation of positive cases\u003c/em>\n\u003cul>\n\u003cli>How is the facility keeping residents who do not have the virus safe from those who do?\u003c/li>\n\u003c/ul>\n\u003c/li>\n\u003cli>\u003cem>Infection control\u003c/em>\n\u003cul>\n\u003cli>Who is the \u003ca href=\"https://apic.org/monthly_alerts/who-are-infection-preventionists/\" target=\"_blank\" rel=\"noopener noreferrer\">infection preventionist\u003c/a>?\u003c/li>\n\u003cli>What changes have been made in the facility to enhance infection prevention?\u003c/li>\n\u003cli>How is the facility monitoring to ensure staff are consistently following infection control standards?\u003c/li>\n\u003c/ul>\n\u003c/li>\n\u003cli>\u003cem>Staffing\u003c/em>\n\u003cul>\n\u003cli>How many staff members are in quarantine?\u003c/li>\n\u003cli>Who is replacing them?\u003c/li>\n\u003cli>Are replacement staff qualified?\u003c/li>\n\u003cli>How do staffing levels now compare to levels before the outbreak?\u003c/li>\n\u003cli>Does the facility have extra staff assigned to replace the care and support visitors provided before the lockdown?\u003c/li>\n\u003c/ul>\n\u003c/li>\n\u003cli>\u003cem>Communication with families\u003c/em>\n\u003cul>\n\u003cli>Who is assigned to keep families updated on an outbreak and what is the facility is doing to fight it?\u003c/li>\n\u003cli>How can families contact this person or persons to seek information or share concerns?\u003c/li>\n\u003cli>By what means and how often will facilities communicate with families?\u003c/li>\n\u003c/ul>\n\u003c/li>\n\u003cli>\u003cem>Visitation\u003c/em>\n\u003cul>\n\u003cli>What is the facility doing to help residents stay in frequent contact with residents or patients via telephone, video visits, window visits and other means?\u003c/li>\n\u003c/ul>\n\u003c/li>\n\u003c/ul>\n\u003cp>If you have a complaint or concern about the care of a loved one in a long-term care facility, you can reach out to a \u003ca href=\"https://www.aging.ca.gov/Find_Services_in_My_County/\" target=\"_blank\" rel=\"noopener noreferrer\">\u003cspan class=\"s1\">local ombudsman\u003c/span>\u003c/a> for assistance. The long-term care ombudsmen are representatives from the California Department of Aging who help residents and their families with issues related to day-to-day care, health, and safety.\u003c/p>\n\u003cp> \u003c/p>\n\u003ch3>Help KQED Science report on the pandemic …\u003c/h3>\n\u003cp>\u003c/p>\u003c/div>",
"attributes": {
"named": {},
"numeric": []
}
},
{
"type": "component",
"content": "",
"name": "hearken",
"attributes": {
"named": {
"src": "https://modules.wearehearken.com/kqed/embed/5489.js",
"label": ""
},
"numeric": []
}
},
{
"type": "contentString",
"content": "\u003cdiv class=\"post-body\">\u003cp>\u003c/p>\n\u003cp>\u003c/p>\u003c/div>",
"attributes": {
"named": {},
"numeric": []
}
},
{
"type": "component",
"content": "",
"name": "ad",
"attributes": {
"named": {
"label": "fullwidth"
},
"numeric": [
"fullwidth"
]
}
},
{
"type": "contentString",
"content": "\u003cdiv class=\"post-body\">\u003cp>\u003c/p>\n\u003cp>\u003c/p>\n\u003c/div>\u003c/p>",
"attributes": {
"named": {},
"numeric": []
}
}
],
"link": "/science/1965221/map-see-which-bay-area-nursing-homes-and-long-term-care-facilities-have-had-coronavirus-outbreaks",
"authors": [
"11653",
"11223",
"11501"
],
"categories": [
"science_39",
"science_40",
"science_4450"
],
"tags": [
"science_4329"
],
"featImg": "science_1965448",
"label": "source_science_1965221"
},
"science_1964094": {
"type": "posts",
"id": "science_1964094",
"meta": {
"index": "posts_1716263798",
"site": "science",
"id": "1964094",
"score": null,
"sort": [
1589392884000
]
},
"parent": 0,
"labelTerm": {},
"blocks": [],
"publishDate": 1589392884,
"format": "standard",
"title": "Bay Area Coronavirus Hospitalizations and Cases Appear Flat, Key Metrics for Reopening",
"headTitle": "Bay Area Coronavirus Hospitalizations and Cases Appear Flat, Key Metrics for Reopening | KQED",
"content": "\u003cp>Last week, Gov. Gavin Newsom announced the easing of California’s unprecedented order confining most people to their homes and shutting down all but essential businesses. Now, across much of California, lower-risk manufacturers and retailers such as bookstores, flower shops, and clothing stores are beginning to reopen, while other businesses like restaurants, malls and salons remain closed, awaiting state approval for the next round.\u003c/p>\n\u003cp>In the Bay Area, six counties — Alameda, Contra Costa, Marin, San Francisco, San Mateo and Santa Clara \u003ci>—\u003c/i> as well as the city of Berkeley, remain under a stricter \u003ca href=\"https://www.kqed.org/news/11816872/while-some-california-covid-19-restrictions-ease-most-bay-area-officials-hold-back\" target=\"_blank\" rel=\"noopener noreferrer\">\u003cspan class=\"s1\">regional stay-at-home order\u003c/span>\u003c/a>, while public health officials further build testing and hospital capacity. (San Francisco and Marin are expected to loosen their orders starting May 18 by allowing curbside pickup at retail stores.)\u003c/p>\n\u003cp>County health officials have outlined five “indicators” of progress they are aiming for as they determine when to allow society to reopen further. These include benchmarks for testing, contact tracing and reserves of protective equipment like masks, face shields, gloves and gowns.\u003c/p>\n\u003cp>The Bay Area appears to currently be meeting at least two of the key metrics, one of which calls for the number of new coronavirus cases to flatten or decrease, the other which sets a target of stable or decreasing COVID-19 hospitilizations for 14 consecutive days. COVID-19 is the illness caused by the coronavirus.\u003c/p>\n\u003cp>Here are the number of patients being treated for COVID-19 in Bay Area hospitals from April 24 through May 7. Use the drop-down menu to see the numbers for each Bay Area county.\u003c/p>\n\u003cp>\u003c!-- iframe plugin v.4.3 wordpress.org/plugins/iframe/ -->\u003cbr>\n\u003ciframe loading=\"lazy\" src=\"https://datawrapper.dwcdn.net/CoYe8/15/\" height=\"400\" width=\"100%\" scrolling=\"yes\" class=\"iframe-class\" frameborder=\"0\">\u003c/iframe>\u003c/p>\n\u003cp>Here are the newly identified coronavirus cases from April 30 through May 10. Again, use the drop-down menu to see the numbers for each Bay Area county.\u003c/p>\n\u003cp>\u003c!-- iframe plugin v.4.3 wordpress.org/plugins/iframe/ -->\u003cbr>\n\u003ciframe loading=\"lazy\" src=\"https://datawrapper.dwcdn.net/GqdBB/11/\" height=\"400\" width=\"100%\" scrolling=\"yes\" class=\"iframe-class\" frameborder=\"0\">\u003c/iframe>\u003c/p>\n\u003cp>On Monday, Grant Colfax, director of the San Francisco Department of Public Health, called out hospitalizations as critical in deciding whether to allow some businesses to reopen on Monday, May 18.\u003c/p>\n\u003cp>“We will be keeping a close eye on the data,” he said. “Specifically, we will be looking at hospitalizations of COVID-positive patients as our metric of whether to move forward with expanded curbside pickup and takeout next week. This is a key metric.”\u003c/p>\n\u003cp>He said hospitalizations for COVID-19 in the city have been flat, in the 70-94 range.\u003c/p>\n\u003cp>“If we can keep within the range for the next week, we anticipate allowing the next group of businesses to reopen,” he said. “If we have a sustained increase in hospitalizations, we will evaluate where the new cases are coming from and shift our focus there.”\u003c/p>\n\u003cp>A spike in the number of people entering the hospital system would indicate that the virus gained strength two weeks prior, and that people who are sick with COVID-19 are requiring intensive care.\u003c/p>\n\u003cp>To see updated case counts for all California counties, check out KQED’s \u003ca href=\"https://www.kqed.org/news/11809760/how-many-california-coronavirus-cases-see-latest-numbers-by-county\" target=\"_blank\" rel=\"noopener noreferrer\">California COVID-19 tracker\u003c/a>.\u003c/p>\n\u003cdiv>\n\u003c!-- iframe plugin v.4.3 wordpress.org/plugins/iframe/ -->\u003cbr>\n\u003ciframe loading=\"lazy\" src=\"https://laist.com/projects/2020/coronavirus-tracker/app/california/index.html\" width=\"1000\" height=\"2300\" scrolling=\"yes\" class=\"iframe-class\" frameborder=\"0\">\u003c/iframe>\n\u003c/div>\n\u003cp>[ad fullwidth]\u003c/p>\n\u003cp>\u003c/p>\n",
"stats": {
"hasVideo": false,
"hasChartOrMap": true,
"hasAudio": false,
"hasPolis": false,
"wordCount": 495,
"hasGoogleForm": false,
"hasGallery": false,
"hasHearkenModule": false,
"iframeSrcs": [
"https://datawrapper.dwcdn.net/CoYe8/15/",
"https://datawrapper.dwcdn.net/GqdBB/11/",
"https://laist.com/projects/2020/coronavirus-tracker/app/california/index.html"
],
"paragraphCount": 16
},
"modified": 1704847424,
"excerpt": "The Bay Area appears to currently be meeting two of the key metrics officials are looking at in deciding when to reopen. ",
"headData": {
"twImgId": "",
"twTitle": "",
"ogTitle": "",
"ogImgId": "",
"twDescription": "",
"description": "The Bay Area appears to currently be meeting two of the key metrics officials are looking at in deciding when to reopen. ",
"title": "Bay Area Coronavirus Hospitalizations and Cases Appear Flat, Key Metrics for Reopening | KQED",
"ogDescription": "",
"schema": {
"@context": "https://schema.org",
"@type": "Article",
"headline": "Bay Area Coronavirus Hospitalizations and Cases Appear Flat, Key Metrics for Reopening",
"datePublished": "2020-05-13T11:01:24-07:00",
"dateModified": "2024-01-09T16:43:44-08:00",
"image": "https://cdn.kqed.org/wp-content/uploads/2020/02/KQED-OG-Image@1x.png"
}
},
"guestAuthors": [],
"slug": "bay-area-coronavirus-hospitalizations-and-cases-appear-flat-key-metrics-for-reopening",
"status": "publish",
"sticky": false,
"source": "Coronavirus",
"path": "/science/1964094/bay-area-coronavirus-hospitalizations-and-cases-appear-flat-key-metrics-for-reopening",
"audioTrackLength": null,
"parsedContent": [
{
"type": "contentString",
"content": "\u003cdiv class=\"post-body\">\u003cp>\u003cp>Last week, Gov. Gavin Newsom announced the easing of California’s unprecedented order confining most people to their homes and shutting down all but essential businesses. Now, across much of California, lower-risk manufacturers and retailers such as bookstores, flower shops, and clothing stores are beginning to reopen, while other businesses like restaurants, malls and salons remain closed, awaiting state approval for the next round.\u003c/p>\n\u003cp>In the Bay Area, six counties — Alameda, Contra Costa, Marin, San Francisco, San Mateo and Santa Clara \u003ci>—\u003c/i> as well as the city of Berkeley, remain under a stricter \u003ca href=\"https://www.kqed.org/news/11816872/while-some-california-covid-19-restrictions-ease-most-bay-area-officials-hold-back\" target=\"_blank\" rel=\"noopener noreferrer\">\u003cspan class=\"s1\">regional stay-at-home order\u003c/span>\u003c/a>, while public health officials further build testing and hospital capacity. (San Francisco and Marin are expected to loosen their orders starting May 18 by allowing curbside pickup at retail stores.)\u003c/p>\n\u003cp>County health officials have outlined five “indicators” of progress they are aiming for as they determine when to allow society to reopen further. These include benchmarks for testing, contact tracing and reserves of protective equipment like masks, face shields, gloves and gowns.\u003c/p>\n\u003cp>The Bay Area appears to currently be meeting at least two of the key metrics, one of which calls for the number of new coronavirus cases to flatten or decrease, the other which sets a target of stable or decreasing COVID-19 hospitilizations for 14 consecutive days. COVID-19 is the illness caused by the coronavirus.\u003c/p>\n\u003cp>Here are the number of patients being treated for COVID-19 in Bay Area hospitals from April 24 through May 7. Use the drop-down menu to see the numbers for each Bay Area county.\u003c/p>\n\u003cp>\u003c!-- iframe plugin v.4.3 wordpress.org/plugins/iframe/ -->\u003cbr>\n\u003ciframe loading=\"lazy\" src=\"https://datawrapper.dwcdn.net/CoYe8/15/\" height=\"400\" width=\"100%\" scrolling=\"yes\" class=\"iframe-class\" frameborder=\"0\">\u003c/iframe>\u003c/p>\n\u003cp>Here are the newly identified coronavirus cases from April 30 through May 10. Again, use the drop-down menu to see the numbers for each Bay Area county.\u003c/p>\n\u003cp>\u003c!-- iframe plugin v.4.3 wordpress.org/plugins/iframe/ -->\u003cbr>\n\u003ciframe loading=\"lazy\" src=\"https://datawrapper.dwcdn.net/GqdBB/11/\" height=\"400\" width=\"100%\" scrolling=\"yes\" class=\"iframe-class\" frameborder=\"0\">\u003c/iframe>\u003c/p>\n\u003cp>On Monday, Grant Colfax, director of the San Francisco Department of Public Health, called out hospitalizations as critical in deciding whether to allow some businesses to reopen on Monday, May 18.\u003c/p>\n\u003cp>“We will be keeping a close eye on the data,” he said. “Specifically, we will be looking at hospitalizations of COVID-positive patients as our metric of whether to move forward with expanded curbside pickup and takeout next week. This is a key metric.”\u003c/p>\n\u003cp>He said hospitalizations for COVID-19 in the city have been flat, in the 70-94 range.\u003c/p>\n\u003cp>“If we can keep within the range for the next week, we anticipate allowing the next group of businesses to reopen,” he said. “If we have a sustained increase in hospitalizations, we will evaluate where the new cases are coming from and shift our focus there.”\u003c/p>\n\u003cp>A spike in the number of people entering the hospital system would indicate that the virus gained strength two weeks prior, and that people who are sick with COVID-19 are requiring intensive care.\u003c/p>\n\u003cp>To see updated case counts for all California counties, check out KQED’s \u003ca href=\"https://www.kqed.org/news/11809760/how-many-california-coronavirus-cases-see-latest-numbers-by-county\" target=\"_blank\" rel=\"noopener noreferrer\">California COVID-19 tracker\u003c/a>.\u003c/p>\n\u003cdiv>\n\u003c!-- iframe plugin v.4.3 wordpress.org/plugins/iframe/ -->\u003cbr>\n\u003ciframe loading=\"lazy\" src=\"https://laist.com/projects/2020/coronavirus-tracker/app/california/index.html\" width=\"1000\" height=\"2300\" scrolling=\"yes\" class=\"iframe-class\" frameborder=\"0\">\u003c/iframe>\n\u003c/div>\n\u003cp>\u003c/p>\u003c/div>",
"attributes": {
"named": {},
"numeric": []
}
},
{
"type": "component",
"content": "",
"name": "ad",
"attributes": {
"named": {
"label": "fullwidth"
},
"numeric": [
"fullwidth"
]
}
},
{
"type": "contentString",
"content": "\u003cdiv class=\"post-body\">\u003cp>\u003c/p>\n\u003cp>\u003c/p>\n\u003c/div>\u003c/p>",
"attributes": {
"named": {},
"numeric": []
}
}
],
"link": "/science/1964094/bay-area-coronavirus-hospitalizations-and-cases-appear-flat-key-metrics-for-reopening",
"authors": [
"11608",
"11501"
],
"categories": [
"science_39",
"science_3890",
"science_40",
"science_4450"
],
"tags": [
"science_4329",
"science_4417",
"science_5181"
],
"featImg": "science_1964095",
"label": "source_science_1964094"
}
},
"podcastsReducer": {
"isFetching": false,
"fetchFailed": false,
"hasFetched": false,
"podcasts": {}
},
"radioProgramsReducer": {
"isFetching": false,
"fetchFailed": false,
"hasFetched": false,
"radioPrograms": {}
},
"programsReducer": {
"all-things-considered": {
"id": "all-things-considered",
"title": "All Things Considered",
"info": "Every weekday, \u003cem>All Things Considered\u003c/em> hosts Robert Siegel, Audie Cornish, Ari Shapiro, and Kelly McEvers present the program's trademark mix of news, interviews, commentaries, reviews, and offbeat features. Michel Martin hosts on the weekends.",
"airtime": "MON-FRI 1pm-2pm, 4:30pm-6:30pm\u003cbr />SAT-SUN 5pm-6pm",
"imageSrc": "https://cdn.kqed.org/wp-content/uploads/2024/04/All-Things-Considered-Podcast-Tile-360x360-1.jpg",
"officialWebsiteLink": "https://www.npr.org/programs/all-things-considered/",
"meta": {
"site": "news",
"source": "npr"
},
"link": "/radio/program/all-things-considered"
},
"american-suburb-podcast": {
"id": "american-suburb-podcast",
"title": "American Suburb: The Podcast",
"tagline": "The flip side of gentrification, told through one town",
"info": "Gentrification is changing cities across America, forcing people from neighborhoods they have long called home. Call them the displaced. Now those priced out of the Bay Area are looking for a better life in an unlikely place. American Suburb follows this migration to one California town along the Delta, 45 miles from San Francisco. But is this once sleepy suburb ready for them?",
"imageSrc": "https://cdn.kqed.org/wp-content/uploads/2024/04/American-Suburb-Podcast-Tile-703x703-1.jpg",
"officialWebsiteLink": "/news/series/american-suburb-podcast",
"meta": {
"site": "news",
"source": "kqed",
"order": 19
},
"link": "/news/series/american-suburb-podcast/",
"subscribe": {
"npr": "https://rpb3r.app.goo.gl/RBrW",
"apple": "https://itunes.apple.com/WebObjects/MZStore.woa/wa/viewPodcast?mt=2&id=1287748328",
"tuneIn": "https://tunein.com/radio/American-Suburb-p1086805/",
"rss": "https://ww2.kqed.org/news/series/american-suburb-podcast/feed/podcast",
"google": "https://podcasts.google.com/feed/aHR0cHM6Ly9mZWVkcy5tZWdhcGhvbmUuZm0vS1FJTkMzMDExODgxNjA5"
}
},
"baycurious": {
"id": "baycurious",
"title": "Bay Curious",
"tagline": "Exploring the Bay Area, one question at a time",
"info": "KQED’s new podcast, Bay Curious, gets to the bottom of the mysteries — both profound and peculiar — that give the Bay Area its unique identity. And we’ll do it with your help! You ask the questions. You decide what Bay Curious investigates. And you join us on the journey to find the answers.",
"imageSrc": "https://cdn.kqed.org/wp-content/uploads/2024/04/Bay-Curious-Podcast-Tile-703x703-1.jpg",
"imageAlt": "KQED Bay Curious",
"officialWebsiteLink": "/news/series/baycurious",
"meta": {
"site": "news",
"source": "kqed",
"order": 3
},
"link": "/podcasts/baycurious",
"subscribe": {
"apple": "https://podcasts.apple.com/us/podcast/bay-curious/id1172473406",
"npr": "https://www.npr.org/podcasts/500557090/bay-curious",
"rss": "https://ww2.kqed.org/news/category/bay-curious-podcast/feed/podcast",
"amazon": "https://music.amazon.com/podcasts/9a90d476-aa04-455d-9a4c-0871ed6216d4/bay-curious",
"stitcher": "https://www.stitcher.com/podcast/kqed/bay-curious",
"spotify": "https://open.spotify.com/show/6O76IdmhixfijmhTZLIJ8k"
}
},
"bbc-world-service": {
"id": "bbc-world-service",
"title": "BBC World Service",
"info": "The day's top stories from BBC News compiled twice daily in the week, once at weekends.",
"airtime": "MON-FRI 9pm-10pm, TUE-FRI 1am-2am",
"imageSrc": "https://cdn.kqed.org/wp-content/uploads/2024/04/BBC-World-Service-Podcast-Tile-360x360-1.jpg",
"officialWebsiteLink": "https://www.bbc.co.uk/sounds/play/live:bbc_world_service",
"meta": {
"site": "news",
"source": "BBC World Service"
},
"link": "/radio/program/bbc-world-service",
"subscribe": {
"apple": "https://itunes.apple.com/us/podcast/global-news-podcast/id135067274?mt=2",
"tuneIn": "https://tunein.com/radio/BBC-World-Service-p455581/",
"rss": "https://podcasts.files.bbci.co.uk/p02nq0gn.rss"
}
},
"californiareport": {
"id": "californiareport",
"title": "The California Report",
"tagline": "California, day by day",
"info": "KQED’s statewide radio news program providing daily coverage of issues, trends and public policy decisions.",
"imageSrc": "https://cdn.kqed.org/wp-content/uploads/2024/04/The-California-Report-Podcast-Tile-703x703-1.jpg",
"imageAlt": "KQED The California Report",
"officialWebsiteLink": "/californiareport",
"meta": {
"site": "news",
"source": "kqed",
"order": 8
},
"link": "/californiareport",
"subscribe": {
"apple": "https://podcasts.apple.com/us/podcast/kqeds-the-california-report/id79681292",
"amazon": "https://music.amazon.com/podcasts/26099305-72af-4542-9dde-ac1807fe36d5/kqed-s-the-california-report",
"npr": "https://www.npr.org/podcasts/432285393/the-california-report",
"stitcher": "https://www.stitcher.com/podcast/kqedfm-kqeds-the-california-report-podcast-8838",
"rss": "https://ww2.kqed.org/news/tag/tcram/feed/podcast"
}
},
"californiareportmagazine": {
"id": "californiareportmagazine",
"title": "The California Report Magazine",
"tagline": "Your state, your stories",
"info": "Every week, The California Report Magazine takes you on a road trip for the ears: to visit the places and meet the people who make California unique. The in-depth storytelling podcast from the California Report.",
"airtime": "FRI 4:30pm-5pm, 6:30pm-7pm, 11pm-11:30pm",
"imageSrc": "https://cdn.kqed.org/wp-content/uploads/2024/04/The-California-Report-Magazine-Podcast-Tile-703x703-1.jpg",
"imageAlt": "KQED The California Report Magazine",
"officialWebsiteLink": "/californiareportmagazine",
"meta": {
"site": "news",
"source": "kqed",
"order": 10
},
"link": "/californiareportmagazine",
"subscribe": {
"apple": "https://podcasts.apple.com/us/podcast/the-california-report-magazine/id1314750545",
"google": "https://podcasts.google.com/feed/aHR0cHM6Ly9mZWVkcy5tZWdhcGhvbmUuZm0vS1FJTkM3NjkwNjk1OTAz",
"npr": "https://www.npr.org/podcasts/564733126/the-california-report-magazine",
"stitcher": "https://www.stitcher.com/podcast/kqed/the-california-report-magazine",
"rss": "https://ww2.kqed.org/news/tag/tcrmag/feed/podcast"
}
},
"city-arts": {
"id": "city-arts",
"title": "City Arts & Lectures",
"info": "A one-hour radio program to hear celebrated writers, artists and thinkers address contemporary ideas and values, often discussing the creative process. Please note: tapes or transcripts are not available",
"imageSrc": "https://ww2.kqed.org/radio/wp-content/uploads/sites/50/2018/05/cityartsandlecture-300x300.jpg",
"officialWebsiteLink": "https://www.cityarts.net/",
"airtime": "SUN 1pm-2pm, TUE 10pm, WED 1am",
"meta": {
"site": "news",
"source": "City Arts & Lectures"
},
"link": "https://www.cityarts.net",
"subscribe": {
"tuneIn": "https://tunein.com/radio/City-Arts-and-Lectures-p692/",
"rss": "https://www.cityarts.net/feed/"
}
},
"closealltabs": {
"id": "closealltabs",
"title": "Close All Tabs",
"tagline": "Your irreverent guide to the trends redefining our world",
"info": "Close All Tabs breaks down how digital culture shapes our world through thoughtful insights and irreverent humor.",
"imageSrc": "https://cdn.kqed.org/wp-content/uploads/2025/02/CAT_2_Tile-scaled.jpg",
"imageAlt": "KQED Close All Tabs",
"officialWebsiteLink": "/podcasts/closealltabs",
"meta": {
"site": "news",
"source": "kqed",
"order": 1
},
"link": "/podcasts/closealltabs",
"subscribe": {
"apple": "https://podcasts.apple.com/us/podcast/close-all-tabs/id214663465",
"rss": "https://feeds.megaphone.fm/KQINC6993880386",
"amazon": "https://music.amazon.com/podcasts/92d9d4ac-67a3-4eed-b10a-fb45d45b1ef2/close-all-tabs",
"spotify": "https://open.spotify.com/show/6LAJFHnGK1pYXYzv6SIol6?si=deb0cae19813417c"
}
},
"code-switch-life-kit": {
"id": "code-switch-life-kit",
"title": "Code Switch / Life Kit",
"info": "\u003cem>Code Switch\u003c/em>, which listeners will hear in the first part of the hour, has fearless and much-needed conversations about race. Hosted by journalists of color, the show tackles the subject of race head-on, exploring how it impacts every part of society — from politics and pop culture to history, sports and more.\u003cbr />\u003cbr />\u003cem>Life Kit\u003c/em>, which will be in the second part of the hour, guides you through spaces and feelings no one prepares you for — from finances to mental health, from workplace microaggressions to imposter syndrome, from relationships to parenting. The show features experts with real world experience and shares their knowledge. Because everyone needs a little help being human.\u003cbr />\u003cbr />\u003ca href=\"https://www.npr.org/podcasts/510312/codeswitch\">\u003cem>Code Switch\u003c/em> offical site and podcast\u003c/a>\u003cbr />\u003ca href=\"https://www.npr.org/lifekit\">\u003cem>Life Kit\u003c/em> offical site and podcast\u003c/a>\u003cbr />",
"airtime": "SUN 9pm-10pm",
"imageSrc": "https://cdn.kqed.org/wp-content/uploads/2024/04/Code-Switch-Life-Kit-Podcast-Tile-360x360-1.jpg",
"meta": {
"site": "radio",
"source": "npr"
},
"link": "/radio/program/code-switch-life-kit",
"subscribe": {
"apple": "https://podcasts.apple.com/podcast/1112190608?mt=2&at=11l79Y&ct=nprdirectory",
"google": "https://podcasts.google.com/feed/aHR0cHM6Ly93d3cubnByLm9yZy9yc3MvcG9kY2FzdC5waHA_aWQ9NTEwMzEy",
"spotify": "https://open.spotify.com/show/3bExJ9JQpkwNhoHvaIIuyV",
"rss": "https://feeds.npr.org/510312/podcast.xml"
}
},
"commonwealth-club": {
"id": "commonwealth-club",
"title": "Commonwealth Club of California Podcast",
"info": "The Commonwealth Club of California is the nation's oldest and largest public affairs forum. As a non-partisan forum, The Club brings to the public airwaves diverse viewpoints on important topics. The Club's weekly radio broadcast - the oldest in the U.S., dating back to 1924 - is carried across the nation on public radio stations and is now podcasting. Our website archive features audio of our recent programs, as well as selected speeches from our long and distinguished history. This podcast feed is usually updated twice a week and is always un-edited.",
"airtime": "THU 10pm, FRI 1am",
"imageSrc": "https://cdn.kqed.org/wp-content/uploads/2024/04/Commonwealth-Club-Podcast-Tile-360x360-1.jpg",
"officialWebsiteLink": "https://www.commonwealthclub.org/podcasts",
"meta": {
"site": "news",
"source": "Commonwealth Club of California"
},
"link": "/radio/program/commonwealth-club",
"subscribe": {
"apple": "https://itunes.apple.com/us/podcast/commonwealth-club-of-california-podcast/id976334034?mt=2",
"google": "https://podcasts.google.com/feed/aHR0cDovL3d3dy5jb21tb253ZWFsdGhjbHViLm9yZy9hdWRpby9wb2RjYXN0L3dlZWtseS54bWw",
"tuneIn": "https://tunein.com/radio/Commonwealth-Club-of-California-p1060/"
}
},
"forum": {
"id": "forum",
"title": "Forum",
"tagline": "The conversation starts here",
"info": "KQED’s live call-in program discussing local, state, national and international issues, as well as in-depth interviews.",
"airtime": "MON-FRI 9am-11am, 10pm-11pm",
"imageSrc": "https://cdn.kqed.org/wp-content/uploads/2024/04/Forum-Podcast-Tile-703x703-1.jpg",
"imageAlt": "KQED Forum with Mina Kim and Alexis Madrigal",
"officialWebsiteLink": "/forum",
"meta": {
"site": "news",
"source": "kqed",
"order": 9
},
"link": "/forum",
"subscribe": {
"apple": "https://podcasts.apple.com/us/podcast/kqeds-forum/id73329719",
"google": "https://podcasts.google.com/feed/aHR0cHM6Ly9mZWVkcy5tZWdhcGhvbmUuZm0vS1FJTkM5NTU3MzgxNjMz",
"npr": "https://www.npr.org/podcasts/432307980/forum",
"stitcher": "https://www.stitcher.com/podcast/kqedfm-kqeds-forum-podcast",
"rss": "https://feeds.megaphone.fm/KQINC9557381633"
}
},
"freakonomics-radio": {
"id": "freakonomics-radio",
"title": "Freakonomics Radio",
"info": "Freakonomics Radio is a one-hour award-winning podcast and public-radio project hosted by Stephen Dubner, with co-author Steve Levitt as a regular guest. It is produced in partnership with WNYC.",
"imageSrc": "https://ww2.kqed.org/news/wp-content/uploads/sites/10/2018/05/freakonomicsRadio.png",
"officialWebsiteLink": "http://freakonomics.com/",
"airtime": "SUN 1am-2am, SAT 3pm-4pm",
"meta": {
"site": "radio",
"source": "WNYC"
},
"link": "/radio/program/freakonomics-radio",
"subscribe": {
"npr": "https://rpb3r.app.goo.gl/4s8b",
"apple": "https://itunes.apple.com/us/podcast/freakonomics-radio/id354668519",
"tuneIn": "https://tunein.com/podcasts/WNYC-Podcasts/Freakonomics-Radio-p272293/",
"rss": "https://feeds.feedburner.com/freakonomicsradio"
}
},
"fresh-air": {
"id": "fresh-air",
"title": "Fresh Air",
"info": "Hosted by Terry Gross, \u003cem>Fresh Air from WHYY\u003c/em> is the Peabody Award-winning weekday magazine of contemporary arts and issues. One of public radio's most popular programs, Fresh Air features intimate conversations with today's biggest luminaries.",
"airtime": "MON-FRI 7pm-8pm",
"imageSrc": "https://cdn.kqed.org/wp-content/uploads/2024/04/Fresh-Air-Podcast-Tile-360x360-1.jpg",
"officialWebsiteLink": "https://www.npr.org/programs/fresh-air/",
"meta": {
"site": "radio",
"source": "npr"
},
"link": "/radio/program/fresh-air",
"subscribe": {
"npr": "https://rpb3r.app.goo.gl/4s8b",
"apple": "https://itunes.apple.com/WebObjects/MZStore.woa/wa/viewPodcast?s=143441&mt=2&id=214089682&at=11l79Y&ct=nprdirectory",
"tuneIn": "https://tunein.com/radio/Fresh-Air-p17/",
"rss": "https://feeds.npr.org/381444908/podcast.xml"
}
},
"here-and-now": {
"id": "here-and-now",
"title": "Here & Now",
"info": "A live production of NPR and WBUR Boston, in collaboration with stations across the country, Here & Now reflects the fluid world of news as it's happening in the middle of the day, with timely, in-depth news, interviews and conversation. Hosted by Robin Young, Jeremy Hobson and Tonya Mosley.",
"airtime": "MON-THU 11am-12pm",
"imageSrc": "https://cdn.kqed.org/wp-content/uploads/2024/04/Here-And-Now-Podcast-Tile-360x360-1.jpg",
"officialWebsiteLink": "http://www.wbur.org/hereandnow",
"meta": {
"site": "news",
"source": "npr"
},
"link": "/radio/program/here-and-now",
"subsdcribe": {
"apple": "https://itunes.apple.com/WebObjects/MZStore.woa/wa/viewPodcast?mt=2&id=426698661",
"tuneIn": "https://tunein.com/radio/Here--Now-p211/",
"rss": "https://feeds.npr.org/510051/podcast.xml"
}
},
"hidden-brain": {
"id": "hidden-brain",
"title": "Hidden Brain",
"info": "Shankar Vedantam uses science and storytelling to reveal the unconscious patterns that drive human behavior, shape our choices and direct our relationships.",
"imageSrc": "https://ww2.kqed.org/radio/wp-content/uploads/sites/50/2018/05/hiddenbrain.jpg",
"officialWebsiteLink": "https://www.npr.org/series/423302056/hidden-brain",
"airtime": "SUN 7pm-8pm",
"meta": {
"site": "news",
"source": "NPR"
},
"link": "/radio/program/hidden-brain",
"subscribe": {
"apple": "https://itunes.apple.com/us/podcast/hidden-brain/id1028908750?mt=2",
"tuneIn": "https://tunein.com/podcasts/Science-Podcasts/Hidden-Brain-p787503/",
"rss": "https://feeds.npr.org/510308/podcast.xml"
}
},
"how-i-built-this": {
"id": "how-i-built-this",
"title": "How I Built This with Guy Raz",
"info": "Guy Raz dives into the stories behind some of the world's best known companies. How I Built This weaves a narrative journey about innovators, entrepreneurs and idealists—and the movements they built.",
"imageSrc": "https://ww2.kqed.org/news/wp-content/uploads/sites/10/2018/05/howIBuiltThis.png",
"officialWebsiteLink": "https://www.npr.org/podcasts/510313/how-i-built-this",
"airtime": "SUN 7:30pm-8pm",
"meta": {
"site": "news",
"source": "npr"
},
"link": "/radio/program/how-i-built-this",
"subscribe": {
"npr": "https://rpb3r.app.goo.gl/3zxy",
"apple": "https://itunes.apple.com/us/podcast/how-i-built-this-with-guy-raz/id1150510297?mt=2",
"tuneIn": "https://tunein.com/podcasts/Arts--Culture-Podcasts/How-I-Built-This-p910896/",
"rss": "https://feeds.npr.org/510313/podcast.xml"
}
},
"hyphenacion": {
"id": "hyphenacion",
"title": "Hyphenación",
"tagline": "Where conversation and cultura meet",
"info": "What kind of no sabo word is Hyphenación? For us, it’s about living within a hyphenation. Like being a third-gen Mexican-American from the Texas border now living that Bay Area Chicano life. Like Xorje! Each week we bring together a couple of hyphenated Latinos to talk all about personal life choices: family, careers, relationships, belonging … everything is on the table. ",
"imageSrc": "https://cdn.kqed.org/wp-content/uploads/2025/03/Hyphenacion_FinalAssets_PodcastTile.png",
"imageAlt": "KQED Hyphenación",
"officialWebsiteLink": "/podcasts/hyphenacion",
"meta": {
"site": "news",
"source": "kqed",
"order": 15
},
"link": "/podcasts/hyphenacion",
"subscribe": {
"apple": "https://podcasts.apple.com/us/podcast/hyphenaci%C3%B3n/id1191591838",
"spotify": "https://open.spotify.com/show/2p3Fifq96nw9BPcmFdIq0o?si=39209f7b25774f38",
"youtube": "https://www.youtube.com/c/kqedarts",
"amazon": "https://music.amazon.com/podcasts/6c3dd23c-93fb-4aab-97ba-1725fa6315f1/hyphenaci%C3%B3n",
"rss": "https://feeds.megaphone.fm/KQINC2275451163"
}
},
"jerrybrown": {
"id": "jerrybrown",
"title": "The Political Mind of Jerry Brown",
"tagline": "Lessons from a lifetime in politics",
"info": "The Political Mind of Jerry Brown brings listeners the wisdom of the former Governor, Mayor, and presidential candidate. Scott Shafer interviewed Brown for more than 40 hours, covering the former governor's life and half-century in the political game – and Brown has some lessons he'd like to share. ",
"imageSrc": "https://cdn.kqed.org/wp-content/uploads/2024/04/The-Political-Mind-of-Jerry-Brown-Podcast-Tile-703x703-1.jpg",
"imageAlt": "KQED The Political Mind of Jerry Brown",
"officialWebsiteLink": "/podcasts/jerrybrown",
"meta": {
"site": "news",
"source": "kqed",
"order": 18
},
"link": "/podcasts/jerrybrown",
"subscribe": {
"npr": "https://www.npr.org/podcasts/790253322/the-political-mind-of-jerry-brown",
"apple": "https://itunes.apple.com/us/podcast/id1492194549",
"rss": "https://ww2.kqed.org/news/series/jerrybrown/feed/podcast/",
"tuneIn": "http://tun.in/pjGcK",
"stitcher": "https://www.stitcher.com/podcast/kqed/the-political-mind-of-jerry-brown",
"spotify": "https://open.spotify.com/show/54C1dmuyFyKMFttY6X2j6r?si=K8SgRCoISNK6ZbjpXrX5-w",
"amazon": "https://music.amazon.com/podcasts/44420f75-3b0e-4301-ab3b-16da6b09e543/the-political-mind-of-jerry-brown"
}
},
"latino-usa": {
"id": "latino-usa",
"title": "Latino USA",
"airtime": "MON 1am-2am, SUN 6pm-7pm",
"info": "Latino USA, the radio journal of news and culture, is the only national, English-language radio program produced from a Latino perspective.",
"imageSrc": "https://ww2.kqed.org/radio/wp-content/uploads/sites/50/2018/04/latinoUsa.jpg",
"officialWebsiteLink": "http://latinousa.org/",
"meta": {
"site": "news",
"source": "npr"
},
"link": "/radio/program/latino-usa",
"subscribe": {
"npr": "https://rpb3r.app.goo.gl/xtTd",
"apple": "https://itunes.apple.com/WebObjects/MZStore.woa/wa/viewPodcast?s=143441&mt=2&id=79681317&at=11l79Y&ct=nprdirectory",
"tuneIn": "https://tunein.com/radio/Latino-USA-p621/",
"rss": "https://feeds.npr.org/510016/podcast.xml"
}
},
"marketplace": {
"id": "marketplace",
"title": "Marketplace",
"info": "Our flagship program, helmed by Kai Ryssdal, examines what the day in money delivered, through stories, conversations, newsworthy numbers and more. Updated Monday through Friday at about 3:30 p.m. PT.",
"airtime": "MON-FRI 4pm-4:30pm, MON-WED 6:30pm-7pm",
"imageSrc": "https://cdn.kqed.org/wp-content/uploads/2024/04/Marketplace-Podcast-Tile-360x360-1.jpg",
"officialWebsiteLink": "https://www.marketplace.org/",
"meta": {
"site": "news",
"source": "American Public Media"
},
"link": "/radio/program/marketplace",
"subscribe": {
"apple": "https://itunes.apple.com/WebObjects/MZStore.woa/wa/viewPodcast?s=143441&mt=2&id=201853034&at=11l79Y&ct=nprdirectory",
"tuneIn": "https://tunein.com/radio/APM-Marketplace-p88/",
"rss": "https://feeds.publicradio.org/public_feeds/marketplace-pm/rss/rss"
}
},
"masters-of-scale": {
"id": "masters-of-scale",
"title": "Masters of Scale",
"info": "Masters of Scale is an original podcast in which LinkedIn co-founder and Greylock Partner Reid Hoffman sets out to describe and prove theories that explain how great entrepreneurs take their companies from zero to a gazillion in ingenious fashion.",
"airtime": "Every other Wednesday June 12 through October 16 at 8pm (repeats Thursdays at 2am)",
"imageSrc": "https://cdn.kqed.org/wp-content/uploads/2024/04/Masters-of-Scale-Podcast-Tile-360x360-1.jpg",
"officialWebsiteLink": "https://mastersofscale.com/",
"meta": {
"site": "radio",
"source": "WaitWhat"
},
"link": "/radio/program/masters-of-scale",
"subscribe": {
"apple": "http://mastersofscale.app.link/",
"rss": "https://rss.art19.com/masters-of-scale"
}
},
"mindshift": {
"id": "mindshift",
"title": "MindShift",
"tagline": "A podcast about the future of learning and how we raise our kids",
"info": "The MindShift podcast explores the innovations in education that are shaping how kids learn. Hosts Ki Sung and Katrina Schwartz introduce listeners to educators, researchers, parents and students who are developing effective ways to improve how kids learn. We cover topics like how fed-up administrators are developing surprising tactics to deal with classroom disruptions; how listening to podcasts are helping kids develop reading skills; the consequences of overparenting; and why interdisciplinary learning can engage students on all ends of the traditional achievement spectrum. This podcast is part of the MindShift education site, a division of KQED News. KQED is an NPR/PBS member station based in San Francisco. You can also visit the MindShift website for episodes and supplemental blog posts or tweet us \u003ca href=\"https://twitter.com/MindShiftKQED\">@MindShiftKQED\u003c/a> or visit us at \u003ca href=\"/mindshift\">MindShift.KQED.org\u003c/a>",
"imageSrc": "https://cdn.kqed.org/wp-content/uploads/2024/04/Mindshift-Podcast-Tile-703x703-1.jpg",
"imageAlt": "KQED MindShift: How We Will Learn",
"officialWebsiteLink": "/mindshift/",
"meta": {
"site": "news",
"source": "kqed",
"order": 12
},
"link": "/podcasts/mindshift",
"subscribe": {
"apple": "https://podcasts.apple.com/us/podcast/mindshift-podcast/id1078765985",
"google": "https://podcasts.google.com/feed/aHR0cHM6Ly9mZWVkcy5tZWdhcGhvbmUuZm0vS1FJTkM1NzY0NjAwNDI5",
"npr": "https://www.npr.org/podcasts/464615685/mind-shift-podcast",
"stitcher": "https://www.stitcher.com/podcast/kqed/stories-teachers-share",
"spotify": "https://open.spotify.com/show/0MxSpNYZKNprFLCl7eEtyx"
}
},
"morning-edition": {
"id": "morning-edition",
"title": "Morning Edition",
"info": "\u003cem>Morning Edition\u003c/em> takes listeners around the country and the world with multi-faceted stories and commentaries every weekday. Hosts Steve Inskeep, David Greene and Rachel Martin bring you the latest breaking news and features to prepare you for the day.",
"airtime": "MON-FRI 3am-9am",
"imageSrc": "https://cdn.kqed.org/wp-content/uploads/2024/04/Morning-Edition-Podcast-Tile-360x360-1.jpg",
"officialWebsiteLink": "https://www.npr.org/programs/morning-edition/",
"meta": {
"site": "news",
"source": "npr"
},
"link": "/radio/program/morning-edition"
},
"onourwatch": {
"id": "onourwatch",
"title": "On Our Watch",
"tagline": "Deeply-reported investigative journalism",
"info": "For decades, the process for how police police themselves has been inconsistent – if not opaque. In some states, like California, these proceedings were completely hidden. After a new police transparency law unsealed scores of internal affairs files, our reporters set out to examine these cases and the shadow world of police discipline. On Our Watch brings listeners into the rooms where officers are questioned and witnesses are interrogated to find out who this system is really protecting. Is it the officers, or the public they've sworn to serve?",
"imageSrc": "https://cdn.kqed.org/wp-content/uploads/2024/04/On-Our-Watch-Podcast-Tile-703x703-1.jpg",
"imageAlt": "On Our Watch from NPR and KQED",
"officialWebsiteLink": "/podcasts/onourwatch",
"meta": {
"site": "news",
"source": "kqed",
"order": 11
},
"link": "/podcasts/onourwatch",
"subscribe": {
"apple": "https://podcasts.apple.com/podcast/id1567098962",
"google": "https://podcasts.google.com/feed/aHR0cHM6Ly9mZWVkcy5ucHIub3JnLzUxMDM2MC9wb2RjYXN0LnhtbD9zYz1nb29nbGVwb2RjYXN0cw",
"npr": "https://rpb3r.app.goo.gl/onourwatch",
"spotify": "https://open.spotify.com/show/0OLWoyizopu6tY1XiuX70x",
"tuneIn": "https://tunein.com/radio/On-Our-Watch-p1436229/",
"stitcher": "https://www.stitcher.com/show/on-our-watch",
"rss": "https://feeds.npr.org/510360/podcast.xml"
}
},
"on-the-media": {
"id": "on-the-media",
"title": "On The Media",
"info": "Our weekly podcast explores how the media 'sausage' is made, casts an incisive eye on fluctuations in the marketplace of ideas, and examines threats to the freedom of information and expression in America and abroad. For one hour a week, the show tries to lift the veil from the process of \"making media,\" especially news media, because it's through that lens that we see the world and the world sees us",
"airtime": "SUN 2pm-3pm, MON 12am-1am",
"imageSrc": "https://ww2.kqed.org/radio/wp-content/uploads/sites/50/2018/04/onTheMedia.png",
"officialWebsiteLink": "https://www.wnycstudios.org/shows/otm",
"meta": {
"site": "news",
"source": "wnyc"
},
"link": "/radio/program/on-the-media",
"subscribe": {
"apple": "https://itunes.apple.com/us/podcast/on-the-media/id73330715?mt=2",
"tuneIn": "https://tunein.com/radio/On-the-Media-p69/",
"rss": "http://feeds.wnyc.org/onthemedia"
}
},
"pbs-newshour": {
"id": "pbs-newshour",
"title": "PBS NewsHour",
"info": "Analysis, background reports and updates from the PBS NewsHour putting today's news in context.",
"airtime": "MON-FRI 3pm-4pm",
"imageSrc": "https://cdn.kqed.org/wp-content/uploads/2024/04/PBS-News-Hour-Podcast-Tile-360x360-1.jpg",
"officialWebsiteLink": "https://www.pbs.org/newshour/",
"meta": {
"site": "news",
"source": "pbs"
},
"link": "/radio/program/pbs-newshour",
"subscribe": {
"apple": "https://itunes.apple.com/us/podcast/pbs-newshour-full-show/id394432287?mt=2",
"tuneIn": "https://tunein.com/radio/PBS-NewsHour---Full-Show-p425698/",
"rss": "https://www.pbs.org/newshour/feeds/rss/podcasts/show"
}
},
"perspectives": {
"id": "perspectives",
"title": "Perspectives",
"tagline": "KQED's series of daily listener commentaries since 1991",
"info": "KQED's series of daily listener commentaries since 1991.",
"imageSrc": "https://cdn.kqed.org/wp-content/uploads/2025/01/Perspectives_Tile_Final.jpg",
"imageAlt": "KQED Perspectives",
"officialWebsiteLink": "/perspectives/",
"meta": {
"site": "radio",
"source": "kqed",
"order": 14
},
"link": "/perspectives",
"subscribe": {
"apple": "https://podcasts.apple.com/us/podcast/id73801135",
"npr": "https://www.npr.org/podcasts/432309616/perspectives",
"rss": "https://ww2.kqed.org/perspectives/category/perspectives/feed/",
"google": "https://podcasts.google.com/feed/aHR0cHM6Ly93dzIua3FlZC5vcmcvcGVyc3BlY3RpdmVzL2NhdGVnb3J5L3BlcnNwZWN0aXZlcy9mZWVkLw"
}
},
"planet-money": {
"id": "planet-money",
"title": "Planet Money",
"info": "The economy explained. Imagine you could call up a friend and say, Meet me at the bar and tell me what's going on with the economy. Now imagine that's actually a fun evening.",
"airtime": "SUN 3pm-4pm",
"imageSrc": "https://ww2.kqed.org/radio/wp-content/uploads/sites/50/2018/04/planetmoney.jpg",
"officialWebsiteLink": "https://www.npr.org/sections/money/",
"meta": {
"site": "news",
"source": "npr"
},
"link": "/radio/program/planet-money",
"subscribe": {
"npr": "https://rpb3r.app.goo.gl/M4f5",
"apple": "https://itunes.apple.com/us/podcast/planet-money/id290783428?mt=2",
"tuneIn": "https://tunein.com/podcasts/Business--Economics-Podcasts/Planet-Money-p164680/",
"rss": "https://feeds.npr.org/510289/podcast.xml"
}
},
"politicalbreakdown": {
"id": "politicalbreakdown",
"title": "Political Breakdown",
"tagline": "Politics from a personal perspective",
"info": "Political Breakdown is a new series that explores the political intersection of California and the nation. Each week hosts Scott Shafer and Marisa Lagos are joined with a new special guest to unpack politics -- with personality — and offer an insider’s glimpse at how politics happens.",
"airtime": "THU 6:30pm-7pm",
"imageSrc": "https://cdn.kqed.org/wp-content/uploads/2024/04/Political-Breakdown-2024-Podcast-Tile-703x703-1.jpg",
"imageAlt": "KQED Political Breakdown",
"officialWebsiteLink": "/podcasts/politicalbreakdown",
"meta": {
"site": "radio",
"source": "kqed",
"order": 5
},
"link": "/podcasts/politicalbreakdown",
"subscribe": {
"apple": "https://podcasts.apple.com/us/podcast/political-breakdown/id1327641087",
"amazon": "https://music.amazon.com/podcasts/e0c2d153-ad36-4c8d-901d-f1da6a724824/political-breakdown",
"npr": "https://www.npr.org/podcasts/572155894/political-breakdown",
"stitcher": "https://www.stitcher.com/podcast/kqed/political-breakdown",
"spotify": "https://open.spotify.com/show/07RVyIjIdk2WDuVehvBMoN",
"rss": "https://ww2.kqed.org/news/tag/political-breakdown/feed/podcast"
}
},
"possible": {
"id": "possible",
"title": "Possible",
"info": "Possible is hosted by entrepreneur Reid Hoffman and writer Aria Finger. Together in Possible, Hoffman and Finger lead enlightening discussions about building a brighter collective future. The show features interviews with visionary guests like Trevor Noah, Sam Altman and Janette Sadik-Khan. Possible paints an optimistic portrait of the world we can create through science, policy, business, art and our shared humanity. It asks: What if everything goes right for once? How can we get there? Each episode also includes a short fiction story generated by advanced AI GPT-4, serving as a thought-provoking springboard to speculate how humanity could leverage technology for good.",
"airtime": "SUN 2pm",
"imageSrc": "https://cdn.kqed.org/wp-content/uploads/2024/04/Possible-Podcast-Tile-360x360-1.jpg",
"officialWebsiteLink": "https://www.possible.fm/",
"meta": {
"site": "news",
"source": "Possible"
},
"link": "/radio/program/possible",
"subscribe": {
"apple": "https://podcasts.apple.com/us/podcast/possible/id1677184070",
"spotify": "https://open.spotify.com/show/730YpdUSNlMyPQwNnyjp4k"
}
},
"pri-the-world": {
"id": "pri-the-world",
"title": "PRI's The World: Latest Edition",
"info": "Each weekday, host Marco Werman and his team of producers bring you the world's most interesting stories in an hour of radio that reminds us just how small our planet really is.",
"airtime": "MON-FRI 2pm-3pm",
"imageSrc": "https://cdn.kqed.org/wp-content/uploads/2024/04/The-World-Podcast-Tile-360x360-1.jpg",
"officialWebsiteLink": "https://www.pri.org/programs/the-world",
"meta": {
"site": "news",
"source": "PRI"
},
"link": "/radio/program/pri-the-world",
"subscribe": {
"apple": "https://itunes.apple.com/us/podcast/pris-the-world-latest-edition/id278196007?mt=2",
"tuneIn": "https://tunein.com/podcasts/News--Politics-Podcasts/PRIs-The-World-p24/",
"rss": "http://feeds.feedburner.com/pri/theworld"
}
},
"radiolab": {
"id": "radiolab",
"title": "Radiolab",
"info": "A two-time Peabody Award-winner, Radiolab is an investigation told through sounds and stories, and centered around one big idea. In the Radiolab world, information sounds like music and science and culture collide. Hosted by Jad Abumrad and Robert Krulwich, the show is designed for listeners who demand skepticism, but appreciate wonder. WNYC Studios is the producer of other leading podcasts including Freakonomics Radio, Death, Sex & Money, On the Media and many more.",
"airtime": "SUN 12am-1am, SAT 2pm-3pm",
"imageSrc": "https://ww2.kqed.org/radio/wp-content/uploads/sites/50/2018/04/radiolab1400.png",
"officialWebsiteLink": "https://www.wnycstudios.org/shows/radiolab/",
"meta": {
"site": "science",
"source": "WNYC"
},
"link": "/radio/program/radiolab",
"subscribe": {
"apple": "https://itunes.apple.com/us/podcast/radiolab/id152249110?mt=2",
"tuneIn": "https://tunein.com/radio/RadioLab-p68032/",
"rss": "https://feeds.wnyc.org/radiolab"
}
},
"reveal": {
"id": "reveal",
"title": "Reveal",
"info": "Created by The Center for Investigative Reporting and PRX, Reveal is public radios first one-hour weekly radio show and podcast dedicated to investigative reporting. Credible, fact based and without a partisan agenda, Reveal combines the power and artistry of driveway moment storytelling with data-rich reporting on critically important issues. The result is stories that inform and inspire, arming our listeners with information to right injustices, hold the powerful accountable and improve lives.Reveal is hosted by Al Letson and showcases the award-winning work of CIR and newsrooms large and small across the nation. In a radio and podcast market crowded with choices, Reveal focuses on important and often surprising stories that illuminate the world for our listeners.",
"airtime": "SAT 4pm-5pm",
"imageSrc": "https://ww2.kqed.org/radio/wp-content/uploads/sites/50/2018/04/reveal300px.png",
"officialWebsiteLink": "https://www.revealnews.org/episodes/",
"meta": {
"site": "news",
"source": "npr"
},
"link": "/radio/program/reveal",
"subscribe": {
"apple": "https://itunes.apple.com/us/podcast/reveal/id886009669",
"tuneIn": "https://tunein.com/radio/Reveal-p679597/",
"rss": "http://feeds.revealradio.org/revealpodcast"
}
},
"rightnowish": {
"id": "rightnowish",
"title": "Rightnowish",
"tagline": "Art is where you find it",
"info": "Rightnowish digs into life in the Bay Area right now… ish. Journalist Pendarvis Harshaw takes us to galleries painted on the sides of liquor stores in West Oakland. We'll dance in warehouses in the Bayview, make smoothies with kids in South Berkeley, and listen to classical music in a 1984 Cutlass Supreme in Richmond. Every week, Pen talks to movers and shakers about how the Bay Area shapes what they create, and how they shape the place we call home.",
"imageSrc": "https://cdn.kqed.org/wp-content/uploads/2024/04/Rightnowish-Podcast-Tile-500x500-1.jpg",
"imageAlt": "KQED Rightnowish with Pendarvis Harshaw",
"officialWebsiteLink": "/podcasts/rightnowish",
"meta": {
"site": "arts",
"source": "kqed",
"order": 16
},
"link": "/podcasts/rightnowish",
"subscribe": {
"npr": "https://www.npr.org/podcasts/721590300/rightnowish",
"rss": "https://ww2.kqed.org/arts/programs/rightnowish/feed/podcast",
"apple": "https://podcasts.apple.com/us/podcast/rightnowish/id1482187648",
"stitcher": "https://www.stitcher.com/podcast/kqed/rightnowish",
"google": "https://podcasts.google.com/feed/aHR0cHM6Ly9mZWVkcy5tZWdhcGhvbmUuZm0vS1FJTkMxMjU5MTY3NDc4",
"spotify": "https://open.spotify.com/show/7kEJuafTzTVan7B78ttz1I"
}
},
"science-friday": {
"id": "science-friday",
"title": "Science Friday",
"info": "Science Friday is a weekly science talk show, broadcast live over public radio stations nationwide. Each week, the show focuses on science topics that are in the news and tries to bring an educated, balanced discussion to bear on the scientific issues at hand. Panels of expert guests join host Ira Flatow, a veteran science journalist, to discuss science and to take questions from listeners during the call-in portion of the program.",
"airtime": "FRI 11am-1pm",
"imageSrc": "https://cdn.kqed.org/wp-content/uploads/2024/04/Science-Friday-Podcast-Tile-360x360-1.jpg",
"officialWebsiteLink": "https://www.wnycstudios.org/shows/science-friday",
"meta": {
"site": "news",
"source": "npr"
},
"link": "/radio/program/science-friday",
"subscribe": {
"apple": "https://itunes.apple.com/WebObjects/MZStore.woa/wa/viewPodcast?s=143441&mt=2&id=73329284&at=11l79Y&ct=nprdirectory",
"tuneIn": "https://tunein.com/radio/Science-Friday-p394/",
"rss": "http://feeds.wnyc.org/science-friday"
}
},
"snap-judgment": {
"id": "snap-judgment",
"title": "Snap Judgment",
"tagline": "Real stories with killer beats",
"info": "The Snap Judgment radio show and podcast mixes real stories with killer beats to produce cinematic, dramatic radio. Snap's musical brand of storytelling dares listeners to see the world through the eyes of another. This is storytelling... with a BEAT!! Snap first aired on public radio stations nationwide in July 2010. Today, Snap Judgment airs on over 450 public radio stations and is brought to the airwaves by KQED & PRX.",
"airtime": "SAT 1pm-2pm, 9pm-10pm",
"imageSrc": "https://cdn.kqed.org/wp-content/uploads/2024/05/Snap-Judgment-Podcast-Tile-703x703-1.jpg",
"imageAlt": "KQED Snap Judgment",
"officialWebsiteLink": "https://snapjudgment.org",
"meta": {
"site": "arts",
"source": "kqed",
"order": 4
},
"link": "https://snapjudgment.org",
"subscribe": {
"apple": "https://podcasts.apple.com/us/podcast/snap-judgment/id283657561",
"npr": "https://www.npr.org/podcasts/449018144/snap-judgment",
"stitcher": "https://www.pandora.com/podcast/snap-judgment/PC:241?source=stitcher-sunset",
"spotify": "https://open.spotify.com/show/3Cct7ZWmxHNAtLgBTqjC5v",
"rss": "https://snap.feed.snapjudgment.org/"
}
},
"soldout": {
"id": "soldout",
"title": "SOLD OUT: Rethinking Housing in America",
"tagline": "A new future for housing",
"info": "Sold Out: Rethinking Housing in America",
"imageSrc": "https://cdn.kqed.org/wp-content/uploads/2024/04/Sold-Out-Podcast-Tile-703x703-1.jpg",
"imageAlt": "KQED Sold Out: Rethinking Housing in America",
"officialWebsiteLink": "/podcasts/soldout",
"meta": {
"site": "news",
"source": "kqed",
"order": 13
},
"link": "/podcasts/soldout",
"subscribe": {
"npr": "https://www.npr.org/podcasts/911586047/s-o-l-d-o-u-t-a-new-future-for-housing",
"apple": "https://podcasts.apple.com/us/podcast/introducing-sold-out-rethinking-housing-in-america/id1531354937",
"rss": "https://feeds.megaphone.fm/soldout",
"spotify": "https://open.spotify.com/show/38dTBSk2ISFoPiyYNoKn1X",
"stitcher": "https://www.stitcher.com/podcast/kqed/sold-out-rethinking-housing-in-america",
"tunein": "https://tunein.com/radio/SOLD-OUT-Rethinking-Housing-in-America-p1365871/"
}
},
"spooked": {
"id": "spooked",
"title": "Spooked",
"tagline": "True-life supernatural stories",
"info": "",
"imageSrc": "https://cdn.kqed.org/wp-content/uploads/2024/10/Spooked-Podcast-Tile-703x703-1.jpg",
"imageAlt": "KQED Spooked",
"officialWebsiteLink": "https://spookedpodcast.org/",
"meta": {
"site": "news",
"source": "kqed",
"order": 7
},
"link": "https://spookedpodcast.org/",
"subscribe": {
"apple": "https://podcasts.apple.com/us/podcast/spooked/id1279361017",
"npr": "https://www.npr.org/podcasts/549547848/snap-judgment-presents-spooked",
"spotify": "https://open.spotify.com/show/76571Rfl3m7PLJQZKQIGCT",
"rss": "https://feeds.simplecast.com/TBotaapn"
}
},
"tech-nation": {
"id": "tech-nation",
"title": "Tech Nation Radio Podcast",
"info": "Tech Nation is a weekly public radio program, hosted by Dr. Moira Gunn. Founded in 1993, it has grown from a simple interview show to a multi-faceted production, featuring conversations with noted technology and science leaders, and a weekly science and technology-related commentary.",
"airtime": "FRI 10pm",
"imageSrc": "https://cdn.kqed.org/wp-content/uploads/2024/04/Tech-Nation-Radio-Podcast-Tile-360x360-1.jpg",
"officialWebsiteLink": "http://technation.podomatic.com/",
"meta": {
"site": "science",
"source": "Tech Nation Media"
},
"link": "/radio/program/tech-nation",
"subscribe": {
"rss": "https://technation.podomatic.com/rss2.xml"
}
},
"ted-radio-hour": {
"id": "ted-radio-hour",
"title": "TED Radio Hour",
"info": "The TED Radio Hour is a journey through fascinating ideas, astonishing inventions, fresh approaches to old problems, and new ways to think and create.",
"airtime": "SUN 3pm-4pm, SAT 10pm-11pm",
"imageSrc": "https://ww2.kqed.org/radio/wp-content/uploads/sites/50/2018/04/tedRadioHour.jpg",
"officialWebsiteLink": "https://www.npr.org/programs/ted-radio-hour/?showDate=2018-06-22",
"meta": {
"site": "news",
"source": "npr"
},
"link": "/radio/program/ted-radio-hour",
"subscribe": {
"npr": "https://rpb3r.app.goo.gl/8vsS",
"apple": "https://itunes.apple.com/WebObjects/MZStore.woa/wa/viewPodcast?s=143441&mt=2&id=523121474&at=11l79Y&ct=nprdirectory",
"tuneIn": "https://tunein.com/radio/TED-Radio-Hour-p418021/",
"rss": "https://feeds.npr.org/510298/podcast.xml"
}
},
"thebay": {
"id": "thebay",
"title": "The Bay",
"tagline": "Local news to keep you rooted",
"info": "Host Devin Katayama walks you through the biggest story of the day with reporters and newsmakers.",
"imageSrc": "https://cdn.kqed.org/wp-content/uploads/2024/04/The-Bay-Podcast-Tile-703x703-1.jpg",
"imageAlt": "KQED The Bay",
"officialWebsiteLink": "/podcasts/thebay",
"meta": {
"site": "radio",
"source": "kqed",
"order": 2
},
"link": "/podcasts/thebay",
"subscribe": {
"apple": "https://podcasts.apple.com/us/podcast/the-bay/id1350043452",
"amazon": "https://music.amazon.com/podcasts/d800ea4c-7a2c-42f2-b861-edaf78a5db0b/the-bay",
"npr": "https://www.npr.org/podcasts/586725995/the-bay",
"stitcher": "https://www.stitcher.com/podcast/kqed/the-bay",
"spotify": "https://open.spotify.com/show/4BIKBKIujizLHlIlBNaAqQ",
"rss": "https://feeds.megaphone.fm/KQINC8259786327"
}
},
"thelatest": {
"id": "thelatest",
"title": "The Latest",
"tagline": "Trusted local news in real time",
"info": "",
"imageSrc": "https://cdn.kqed.org/wp-content/uploads/2025/05/The-Latest-2025-Podcast-Tile-703x703-1.jpg",
"imageAlt": "KQED The Latest",
"officialWebsiteLink": "/thelatest",
"meta": {
"site": "news",
"source": "kqed",
"order": 6
},
"link": "/thelatest",
"subscribe": {
"apple": "https://podcasts.apple.com/us/podcast/the-latest-from-kqed/id1197721799",
"npr": "https://www.npr.org/podcasts/1257949365/the-latest-from-k-q-e-d",
"spotify": "https://open.spotify.com/show/5KIIXMgM9GTi5AepwOYvIZ?si=bd3053fec7244dba",
"rss": "https://feeds.megaphone.fm/KQINC9137121918"
}
},
"theleap": {
"id": "theleap",
"title": "The Leap",
"tagline": "What if you closed your eyes, and jumped?",
"info": "Stories about people making dramatic, risky changes, told by award-winning public radio reporter Judy Campbell.",
"imageSrc": "https://cdn.kqed.org/wp-content/uploads/2024/04/The-Leap-Podcast-Tile-703x703-1.jpg",
"imageAlt": "KQED The Leap",
"officialWebsiteLink": "/podcasts/theleap",
"meta": {
"site": "news",
"source": "kqed",
"order": 17
},
"link": "/podcasts/theleap",
"subscribe": {
"apple": "https://podcasts.apple.com/us/podcast/the-leap/id1046668171",
"npr": "https://www.npr.org/podcasts/447248267/the-leap",
"stitcher": "https://www.stitcher.com/podcast/kqed/the-leap",
"spotify": "https://open.spotify.com/show/3sSlVHHzU0ytLwuGs1SD1U",
"rss": "https://ww2.kqed.org/news/programs/the-leap/feed/podcast"
}
},
"the-moth-radio-hour": {
"id": "the-moth-radio-hour",
"title": "The Moth Radio Hour",
"info": "Since its launch in 1997, The Moth has presented thousands of true stories, told live and without notes, to standing-room-only crowds worldwide. Moth storytellers stand alone, under a spotlight, with only a microphone and a roomful of strangers. The storyteller and the audience embark on a high-wire act of shared experience which is both terrifying and exhilarating. Since 2008, The Moth podcast has featured many of our favorite stories told live on Moth stages around the country. For information on all of our programs and live events, visit themoth.org.",
"airtime": "SAT 8pm-9pm and SUN 11am-12pm",
"imageSrc": "https://ww2.kqed.org/radio/wp-content/uploads/sites/50/2018/04/theMoth.jpg",
"officialWebsiteLink": "https://themoth.org/",
"meta": {
"site": "arts",
"source": "prx"
},
"link": "/radio/program/the-moth-radio-hour",
"subscribe": {
"apple": "https://itunes.apple.com/us/podcast/the-moth-podcast/id275699983?mt=2",
"tuneIn": "https://tunein.com/radio/The-Moth-p273888/",
"rss": "http://feeds.themoth.org/themothpodcast"
}
},
"the-new-yorker-radio-hour": {
"id": "the-new-yorker-radio-hour",
"title": "The New Yorker Radio Hour",
"info": "The New Yorker Radio Hour is a weekly program presented by the magazine's editor, David Remnick, and produced by WNYC Studios and The New Yorker. Each episode features a diverse mix of interviews, profiles, storytelling, and an occasional burst of humor inspired by the magazine, and shaped by its writers, artists, and editors. This isn't a radio version of a magazine, but something all its own, reflecting the rich possibilities of audio storytelling and conversation. Theme music for the show was composed and performed by Merrill Garbus of tUnE-YArDs.",
"airtime": "SAT 10am-11am",
"imageSrc": "https://cdn.kqed.org/wp-content/uploads/2024/04/The-New-Yorker-Podcast-Tile-360x360-1.jpg",
"officialWebsiteLink": "https://www.wnycstudios.org/shows/tnyradiohour",
"meta": {
"site": "arts",
"source": "WNYC"
},
"link": "/radio/program/the-new-yorker-radio-hour",
"subscribe": {
"apple": "https://itunes.apple.com/us/podcast/id1050430296",
"tuneIn": "https://tunein.com/podcasts/WNYC-Podcasts/New-Yorker-Radio-Hour-p803804/",
"rss": "https://feeds.feedburner.com/newyorkerradiohour"
}
},
"the-sam-sanders-show": {
"id": "the-sam-sanders-show",
"title": "The Sam Sanders Show",
"info": "One of public radio's most dynamic voices, Sam Sanders helped launch The NPR Politics Podcast and hosted NPR's hit show It's Been A Minute. Now, the award-winning host returns with something brand new, The Sam Sanders Show. Every week, Sam Sanders and friends dig into the culture that shapes our lives: what's driving the biggest trends, how artists really think, and even the memes you can't stop scrolling past. Sam is beloved for his way of unpacking the world and bringing you up close to fresh currents and engaging conversations. The Sam Sanders Show is smart, funny and always a good time.",
"airtime": "FRI 12-1pm AND SAT 11am-12pm",
"imageSrc": "https://cdn.kqed.org/wp-content/uploads/2025/11/The-Sam-Sanders-Show-Podcast-Tile-400x400-1.jpg",
"officialWebsiteLink": "https://www.kcrw.com/shows/the-sam-sanders-show/latest",
"meta": {
"site": "arts",
"source": "KCRW"
},
"link": "https://www.kcrw.com/shows/the-sam-sanders-show/latest",
"subscribe": {
"rss": "https://feed.cdnstream1.com/zjb/feed/download/ac/28/59/ac28594c-e1d0-4231-8728-61865cdc80e8.xml"
}
},
"the-splendid-table": {
"id": "the-splendid-table",
"title": "The Splendid Table",
"info": "\u003cem>The Splendid Table\u003c/em> hosts our nation's conversations about cooking, sustainability and food culture.",
"imageSrc": "https://cdn.kqed.org/wp-content/uploads/2024/04/The-Splendid-Table-Podcast-Tile-360x360-1.jpg",
"officialWebsiteLink": "https://www.splendidtable.org/",
"airtime": "SUN 10-11 pm",
"meta": {
"site": "radio",
"source": "npr"
},
"link": "/radio/program/the-splendid-table"
},
"this-american-life": {
"id": "this-american-life",
"title": "This American Life",
"info": "This American Life is a weekly public radio show, heard by 2.2 million people on more than 500 stations. Another 2.5 million people download the weekly podcast. It is hosted by Ira Glass, produced in collaboration with Chicago Public Media, delivered to stations by PRX The Public Radio Exchange, and has won all of the major broadcasting awards.",
"airtime": "SAT 12pm-1pm, 7pm-8pm",
"imageSrc": "https://ww2.kqed.org/radio/wp-content/uploads/sites/50/2018/04/thisAmericanLife.png",
"officialWebsiteLink": "https://www.thisamericanlife.org/",
"meta": {
"site": "news",
"source": "wbez"
},
"link": "/radio/program/this-american-life",
"subscribe": {
"apple": "https://itunes.apple.com/WebObjects/MZStore.woa/wa/viewPodcast?s=143441&mt=2&id=201671138&at=11l79Y&ct=nprdirectory",
"rss": "https://www.thisamericanlife.org/podcast/rss.xml"
}
},
"tinydeskradio": {
"id": "tinydeskradio",
"title": "Tiny Desk Radio",
"info": "We're bringing the best of Tiny Desk to the airwaves, only on public radio.",
"airtime": "SUN 8pm and SAT 9pm",
"imageSrc": "https://cdn.kqed.org/wp-content/uploads/2025/04/300x300-For-Member-Station-Logo-Tiny-Desk-Radio-@2x.png",
"officialWebsiteLink": "https://www.npr.org/series/g-s1-52030/tiny-desk-radio",
"meta": {
"site": "news",
"source": "npr"
},
"link": "/radio/program/tinydeskradio",
"subscribe": {
"rss": "https://feeds.npr.org/g-s1-52030/rss.xml"
}
},
"wait-wait-dont-tell-me": {
"id": "wait-wait-dont-tell-me",
"title": "Wait Wait... Don't Tell Me!",
"info": "Peter Sagal and Bill Kurtis host the weekly NPR News quiz show alongside some of the best and brightest news and entertainment personalities.",
"airtime": "SUN 10am-11am, SAT 11am-12pm, SAT 6pm-7pm",
"imageSrc": "https://cdn.kqed.org/wp-content/uploads/2024/04/Wait-Wait-Podcast-Tile-300x300-1.jpg",
"officialWebsiteLink": "https://www.npr.org/programs/wait-wait-dont-tell-me/",
"meta": {
"site": "news",
"source": "npr"
},
"link": "/radio/program/wait-wait-dont-tell-me",
"subscribe": {
"npr": "https://rpb3r.app.goo.gl/Xogv",
"apple": "https://itunes.apple.com/WebObjects/MZStore.woa/wa/viewPodcast?s=143441&mt=2&id=121493804&at=11l79Y&ct=nprdirectory",
"tuneIn": "https://tunein.com/radio/Wait-Wait-Dont-Tell-Me-p46/",
"rss": "https://feeds.npr.org/344098539/podcast.xml"
}
},
"weekend-edition-saturday": {
"id": "weekend-edition-saturday",
"title": "Weekend Edition Saturday",
"info": "Weekend Edition Saturday wraps up the week's news and offers a mix of analysis and features on a wide range of topics, including arts, sports, entertainment, and human interest stories. The two-hour program is hosted by NPR's Peabody Award-winning Scott Simon.",
"airtime": "SAT 5am-10am",
"imageSrc": "https://cdn.kqed.org/wp-content/uploads/2024/04/Weekend-Edition-Podcast-Tile-360x360-1.jpg",
"officialWebsiteLink": "https://www.npr.org/programs/weekend-edition-saturday/",
"meta": {
"site": "news",
"source": "npr"
},
"link": "/radio/program/weekend-edition-saturday"
},
"weekend-edition-sunday": {
"id": "weekend-edition-sunday",
"title": "Weekend Edition Sunday",
"info": "Weekend Edition Sunday features interviews with newsmakers, artists, scientists, politicians, musicians, writers, theologians and historians. The program has covered news events from Nelson Mandela's 1990 release from a South African prison to the capture of Saddam Hussein.",
"airtime": "SUN 5am-10am",
"imageSrc": "https://cdn.kqed.org/wp-content/uploads/2024/04/Weekend-Edition-Podcast-Tile-360x360-1.jpg",
"officialWebsiteLink": "https://www.npr.org/programs/weekend-edition-sunday/",
"meta": {
"site": "news",
"source": "npr"
},
"link": "/radio/program/weekend-edition-sunday"
}
},
"racesReducer": {},
"racesGenElectionReducer": {},
"racesGenElection2026Reducer": {},
"radioSchedulesReducer": {},
"listsReducer": {
"posts?author=11501&authorName=Teodros Hailye": {
"isFetching": false,
"latestQuery": {
"from": 0,
"size": 9
},
"vitalsOnly": false,
"totalRequested": 9,
"isLoading": false,
"isLoadingMore": true,
"total": {
"value": 13,
"relation": "eq"
},
"items": [
"science_1979645",
"science_1975814",
"science_1974894",
"science_1974195",
"science_1973624",
"science_1966305",
"science_1964968",
"science_1965221",
"science_1964094"
],
"complete": true
}
},
"recallGuideReducer": {
"intros": {},
"policy": {},
"candidates": {}
},
"savedArticleReducer": {
"articles": [],
"status": {}
},
"newslettersReducer": {
"isFetching": false,
"fetchFailed": false,
"hasFetched": false,
"newsletters": {},
"isSubscribing": false,
"isUnsubscribing": false,
"subscribedNewsletters": {}
},
"termsReducer": {
"about": {
"name": "About",
"type": "terms",
"id": "about",
"slug": "about",
"link": "/about",
"taxonomy": "site"
},
"arts": {
"name": "Arts & Culture",
"grouping": [
"arts",
"pop",
"trulyca"
],
"description": "KQED Arts provides daily in-depth coverage of the Bay Area's music, art, film, performing arts, literature and arts news, as well as cultural commentary and criticism.",
"type": "terms",
"id": "arts",
"slug": "arts",
"link": "/arts",
"taxonomy": "site"
},
"artschool": {
"name": "Art School",
"parent": "arts",
"type": "terms",
"id": "artschool",
"slug": "artschool",
"link": "/artschool",
"taxonomy": "site"
},
"bayareabites": {
"name": "KQED food",
"grouping": [
"food",
"bayareabites",
"checkplease"
],
"parent": "food",
"type": "terms",
"id": "bayareabites",
"slug": "bayareabites",
"link": "/food",
"taxonomy": "site"
},
"bayareahiphop": {
"name": "Bay Area Hiphop",
"type": "terms",
"id": "bayareahiphop",
"slug": "bayareahiphop",
"link": "/bayareahiphop",
"taxonomy": "site"
},
"campaign21": {
"name": "Campaign 21",
"type": "terms",
"id": "campaign21",
"slug": "campaign21",
"link": "/campaign21",
"taxonomy": "site"
},
"careers": {
"name": "Careers",
"type": "terms",
"id": "careers",
"slug": "careers",
"link": "/careers",
"taxonomy": "site"
},
"checkplease": {
"name": "KQED food",
"grouping": [
"food",
"bayareabites",
"checkplease"
],
"parent": "food",
"type": "terms",
"id": "checkplease",
"slug": "checkplease",
"link": "/food",
"taxonomy": "site"
},
"education": {
"name": "Education",
"grouping": [
"education"
],
"type": "terms",
"id": "education",
"slug": "education",
"link": "/education",
"taxonomy": "site"
},
"elections": {
"name": "Elections",
"type": "terms",
"id": "elections",
"slug": "elections",
"link": "/elections",
"taxonomy": "site"
},
"events": {
"name": "Events",
"type": "terms",
"id": "events",
"slug": "events",
"link": "/events",
"taxonomy": "site"
},
"event": {
"name": "Event",
"alias": "events",
"type": "terms",
"id": "event",
"slug": "event",
"link": "/event",
"taxonomy": "site"
},
"filmschoolshorts": {
"name": "Film School Shorts",
"type": "terms",
"id": "filmschoolshorts",
"slug": "filmschoolshorts",
"link": "/filmschoolshorts",
"taxonomy": "site"
},
"food": {
"name": "KQED food",
"grouping": [
"food",
"bayareabites",
"checkplease"
],
"type": "terms",
"id": "food",
"slug": "food",
"link": "/food",
"taxonomy": "site"
},
"forum": {
"name": "Forum",
"relatedContentQuery": "posts/forum?",
"parent": "news",
"type": "terms",
"id": "forum",
"slug": "forum",
"link": "/forum",
"taxonomy": "site"
},
"futureofyou": {
"name": "Future of You",
"grouping": [
"science",
"futureofyou"
],
"parent": "science",
"type": "terms",
"id": "futureofyou",
"slug": "futureofyou",
"link": "/futureofyou",
"taxonomy": "site"
},
"jpepinheart": {
"name": "KQED food",
"relatedContentQuery": "posts/food,bayareabites,checkplease",
"parent": "food",
"type": "terms",
"id": "jpepinheart",
"slug": "jpepinheart",
"link": "/food",
"taxonomy": "site"
},
"liveblog": {
"name": "Live Blog",
"type": "terms",
"id": "liveblog",
"slug": "liveblog",
"link": "/liveblog",
"taxonomy": "site"
},
"livetv": {
"name": "Live TV",
"parent": "tv",
"type": "terms",
"id": "livetv",
"slug": "livetv",
"link": "/livetv",
"taxonomy": "site"
},
"lowdown": {
"name": "The Lowdown",
"relatedContentQuery": "posts/lowdown?",
"parent": "news",
"type": "terms",
"id": "lowdown",
"slug": "lowdown",
"link": "/lowdown",
"taxonomy": "site"
},
"mindshift": {
"name": "Mindshift",
"parent": "news",
"description": "MindShift explores the future of education by highlighting the innovative – and sometimes counterintuitive – ways educators and parents are helping all children succeed.",
"type": "terms",
"id": "mindshift",
"slug": "mindshift",
"link": "/mindshift",
"taxonomy": "site"
},
"news": {
"name": "News",
"grouping": [
"news",
"forum"
],
"type": "terms",
"id": "news",
"slug": "news",
"link": "/news",
"taxonomy": "site"
},
"newsletters": {
"name": "newsletters",
"type": "terms",
"id": "newsletters",
"slug": "newsletters",
"link": "/newsletters",
"taxonomy": "site"
},
"perspectives": {
"name": "Perspectives",
"parent": "radio",
"type": "terms",
"id": "perspectives",
"slug": "perspectives",
"link": "/perspectives",
"taxonomy": "site"
},
"podcasts": {
"name": "Podcasts",
"type": "terms",
"id": "podcasts",
"slug": "podcasts",
"link": "/podcasts",
"taxonomy": "site"
},
"pop": {
"name": "Pop",
"parent": "arts",
"type": "terms",
"id": "pop",
"slug": "pop",
"link": "/pop",
"taxonomy": "site"
},
"pressroom": {
"name": "Pressroom",
"type": "terms",
"id": "pressroom",
"slug": "pressroom",
"link": "/pressroom",
"taxonomy": "site"
},
"quest": {
"name": "Quest",
"parent": "science",
"type": "terms",
"id": "quest",
"slug": "quest",
"link": "/quest",
"taxonomy": "site"
},
"radio": {
"name": "Radio",
"grouping": [
"forum",
"perspectives"
],
"description": "Listen to KQED Public Radio – home of Forum and The California Report – on 88.5 FM in San Francisco, 89.3 FM in Sacramento, 88.3 FM in Santa Rosa and 88.1 FM in Martinez.",
"type": "terms",
"id": "radio",
"slug": "radio",
"link": "/radio",
"taxonomy": "site"
},
"root": {
"name": "KQED",
"image": "https://ww2.kqed.org/app/uploads/2020/02/KQED-OG-Image@1x.png",
"imageWidth": 1200,
"imageHeight": 630,
"headData": {
"title": "KQED | News, Radio, Podcasts, TV | Public Media for Northern California",
"description": "KQED provides public radio, television, and independent reporting on issues that matter to the Bay Area. We’re the NPR and PBS member station for Northern California."
},
"type": "terms",
"id": "root",
"slug": "root",
"link": "/root",
"taxonomy": "site"
},
"science": {
"name": "Science",
"grouping": [
"science",
"futureofyou"
],
"description": "KQED Science brings you award-winning science and environment coverage from the Bay Area and beyond.",
"type": "terms",
"id": "science",
"slug": "science",
"link": "/science",
"taxonomy": "site"
},
"stateofhealth": {
"name": "State of Health",
"parent": "science",
"type": "terms",
"id": "stateofhealth",
"slug": "stateofhealth",
"link": "/stateofhealth",
"taxonomy": "site"
},
"support": {
"name": "Support",
"type": "terms",
"id": "support",
"slug": "support",
"link": "/support",
"taxonomy": "site"
},
"thedolist": {
"name": "The Do List",
"parent": "arts",
"type": "terms",
"id": "thedolist",
"slug": "thedolist",
"link": "/thedolist",
"taxonomy": "site"
},
"trulyca": {
"name": "Truly CA",
"grouping": [
"arts",
"pop",
"trulyca"
],
"parent": "arts",
"type": "terms",
"id": "trulyca",
"slug": "trulyca",
"link": "/trulyca",
"taxonomy": "site"
},
"tv": {
"name": "TV",
"type": "terms",
"id": "tv",
"slug": "tv",
"link": "/tv",
"taxonomy": "site"
},
"voterguide": {
"name": "Voter Guide",
"parent": "elections",
"alias": "elections",
"type": "terms",
"id": "voterguide",
"slug": "voterguide",
"link": "/voterguide",
"taxonomy": "site"
},
"guiaelectoral": {
"name": "Guia Electoral",
"parent": "elections",
"alias": "elections",
"type": "terms",
"id": "guiaelectoral",
"slug": "guiaelectoral",
"link": "/guiaelectoral",
"taxonomy": "site"
},
"source_science_1979645": {
"type": "terms",
"id": "source_science_1979645",
"meta": {
"override": true
},
"name": "Climate Change",
"isLoading": false
},
"source_science_1975814": {
"type": "terms",
"id": "source_science_1975814",
"meta": {
"override": true
},
"name": "Wildfire",
"isLoading": false
},
"source_science_1974195": {
"type": "terms",
"id": "source_science_1974195",
"meta": {
"override": true
},
"name": "Sea Level Rise",
"isLoading": false
},
"source_science_1973624": {
"type": "terms",
"id": "source_science_1973624",
"meta": {
"override": true
},
"name": "Sea Level Rise",
"isLoading": false
},
"source_science_1966305": {
"type": "terms",
"id": "source_science_1966305",
"meta": {
"override": true
},
"name": "Coronavirus",
"isLoading": false
},
"source_science_1964968": {
"type": "terms",
"id": "source_science_1964968",
"meta": {
"override": true
},
"name": "Coronavirus",
"isLoading": false
},
"source_science_1965221": {
"type": "terms",
"id": "source_science_1965221",
"meta": {
"override": true
},
"name": "Coronavirus",
"isLoading": false
},
"source_science_1964094": {
"type": "terms",
"id": "source_science_1964094",
"meta": {
"override": true
},
"name": "Coronavirus",
"isLoading": false
},
"science_31": {
"type": "terms",
"id": "science_31",
"meta": {
"index": "terms_1716263798",
"site": "science",
"id": "31",
"found": true
},
"relationships": {},
"featImg": null,
"name": "Climate",
"description": null,
"taxonomy": "category",
"headData": {
"twImgId": null,
"twTitle": null,
"ogTitle": null,
"ogImgId": null,
"twDescription": null,
"description": null,
"title": "Climate Archives | KQED Science",
"ogDescription": null
},
"ttid": 33,
"slug": "climate",
"isLoading": false,
"link": "/science/category/climate"
},
"science_35": {
"type": "terms",
"id": "science_35",
"meta": {
"index": "terms_1716263798",
"site": "science",
"id": "35",
"found": true
},
"relationships": {},
"featImg": null,
"name": "Environment",
"description": null,
"taxonomy": "category",
"headData": {
"twImgId": null,
"twTitle": null,
"ogTitle": null,
"ogImgId": null,
"twDescription": null,
"description": null,
"title": "Environment Archives | KQED Science",
"ogDescription": null
},
"ttid": 37,
"slug": "environment",
"isLoading": false,
"link": "/science/category/environment"
},
"science_40": {
"type": "terms",
"id": "science_40",
"meta": {
"index": "terms_1716263798",
"site": "science",
"id": "40",
"found": true
},
"relationships": {},
"featImg": null,
"name": "News",
"description": null,
"taxonomy": "category",
"headData": {
"twImgId": null,
"twTitle": null,
"ogTitle": null,
"ogImgId": null,
"twDescription": null,
"description": null,
"title": "News Archives | KQED Science",
"ogDescription": null
},
"ttid": 42,
"slug": "news",
"isLoading": false,
"link": "/science/category/news"
},
"science_2873": {
"type": "terms",
"id": "science_2873",
"meta": {
"index": "terms_1716263798",
"site": "science",
"id": "2873",
"found": true
},
"relationships": {},
"featImg": null,
"name": "Oceans",
"description": null,
"taxonomy": "category",
"headData": {
"twImgId": null,
"twTitle": null,
"ogTitle": null,
"ogImgId": null,
"twDescription": null,
"description": null,
"title": "Oceans Archives | KQED Science",
"ogDescription": null
},
"ttid": 2873,
"slug": "oceans",
"isLoading": false,
"link": "/science/category/oceans"
},
"science_4450": {
"type": "terms",
"id": "science_4450",
"meta": {
"index": "terms_1716263798",
"site": "science",
"id": "4450",
"found": true
},
"relationships": {},
"featImg": null,
"name": "Science",
"description": null,
"taxonomy": "category",
"headData": {
"twImgId": null,
"twTitle": null,
"ogTitle": null,
"ogImgId": null,
"twDescription": null,
"description": null,
"title": "Science Archives | KQED Science",
"ogDescription": null
},
"ttid": 4450,
"slug": "science",
"isLoading": false,
"link": "/science/category/science"
},
"science_5178": {
"type": "terms",
"id": "science_5178",
"meta": {
"index": "terms_1716263798",
"site": "science",
"id": "5178",
"found": true
},
"relationships": {},
"featImg": null,
"name": "California",
"description": null,
"taxonomy": "tag",
"headData": {
"twImgId": null,
"twTitle": null,
"ogTitle": null,
"ogImgId": null,
"twDescription": null,
"description": null,
"title": "California Archives | KQED Science",
"ogDescription": null
},
"ttid": 5178,
"slug": "california",
"isLoading": false,
"link": "/science/tag/california"
},
"science_194": {
"type": "terms",
"id": "science_194",
"meta": {
"index": "terms_1716263798",
"site": "science",
"id": "194",
"found": true
},
"relationships": {},
"featImg": null,
"name": "climate change",
"description": null,
"taxonomy": "tag",
"headData": {
"twImgId": null,
"twTitle": null,
"ogTitle": null,
"ogImgId": null,
"twDescription": null,
"description": null,
"title": "climate change Archives | KQED Science",
"ogDescription": null
},
"ttid": 198,
"slug": "climate-change",
"isLoading": false,
"link": "/science/tag/climate-change"
},
"science_4859": {
"type": "terms",
"id": "science_4859",
"meta": {
"index": "terms_1716263798",
"site": "science",
"id": "4859",
"found": true
},
"relationships": {},
"featImg": null,
"name": "groundwater rise",
"description": null,
"taxonomy": "tag",
"headData": {
"twImgId": null,
"twTitle": null,
"ogTitle": null,
"ogImgId": null,
"twDescription": null,
"description": null,
"title": "groundwater rise Archives | KQED Science",
"ogDescription": null
},
"ttid": 4859,
"slug": "groundwater-rise",
"isLoading": false,
"link": "/science/tag/groundwater-rise"
},
"science_206": {
"type": "terms",
"id": "science_206",
"meta": {
"index": "terms_1716263798",
"site": "science",
"id": "206",
"found": true
},
"relationships": {},
"featImg": null,
"name": "sea level rise",
"description": null,
"taxonomy": "tag",
"headData": {
"twImgId": null,
"twTitle": null,
"ogTitle": null,
"ogImgId": null,
"twDescription": null,
"description": null,
"title": "sea level rise Archives | KQED Science",
"ogDescription": null
},
"ttid": 210,
"slug": "sea-level-rise",
"isLoading": false,
"link": "/science/tag/sea-level-rise"
},
"science_3730": {
"type": "terms",
"id": "science_3730",
"meta": {
"index": "terms_1716263798",
"site": "science",
"id": "3730",
"found": true
},
"relationships": {},
"featImg": null,
"name": "Wildfires",
"description": null,
"taxonomy": "category",
"headData": {
"twImgId": null,
"twTitle": null,
"ogTitle": null,
"ogImgId": null,
"twDescription": null,
"description": null,
"title": "Wildfires Archives | KQED Science",
"ogDescription": null
},
"ttid": 3730,
"slug": "wildfires",
"isLoading": false,
"link": "/science/category/wildfires"
},
"science_4414": {
"type": "terms",
"id": "science_4414",
"meta": {
"index": "terms_1716263798",
"site": "science",
"id": "4414",
"found": true
},
"relationships": {},
"featImg": null,
"name": "featured-science",
"description": null,
"taxonomy": "tag",
"headData": {
"twImgId": null,
"twTitle": null,
"ogTitle": null,
"ogImgId": null,
"twDescription": null,
"description": null,
"title": "featured-science Archives | KQED Science",
"ogDescription": null
},
"ttid": 4414,
"slug": "featured-science",
"isLoading": false,
"link": "/science/tag/featured-science"
},
"science_2184": {
"type": "terms",
"id": "science_2184",
"meta": {
"index": "terms_1716263798",
"site": "science",
"id": "2184",
"found": true
},
"relationships": {},
"featImg": null,
"name": "heat",
"description": null,
"taxonomy": "tag",
"headData": {
"twImgId": null,
"twTitle": null,
"ogTitle": null,
"ogImgId": null,
"twDescription": null,
"description": null,
"title": "heat Archives | KQED Science",
"ogDescription": null
},
"ttid": 2196,
"slug": "heat",
"isLoading": false,
"link": "/science/tag/heat"
},
"science_113": {
"type": "terms",
"id": "science_113",
"meta": {
"index": "terms_1716263798",
"site": "science",
"id": "113",
"found": true
},
"relationships": {},
"featImg": null,
"name": "wildfire",
"description": null,
"taxonomy": "tag",
"headData": {
"twImgId": null,
"twTitle": null,
"ogTitle": null,
"ogImgId": null,
"twDescription": null,
"description": null,
"title": "wildfire Archives | KQED Science",
"ogDescription": null
},
"ttid": 117,
"slug": "wildfire",
"isLoading": false,
"link": "/science/tag/wildfire"
},
"science_5184": {
"type": "terms",
"id": "science_5184",
"meta": {
"index": "terms_1716263798",
"site": "science",
"id": "5184",
"found": true
},
"relationships": {},
"featImg": null,
"name": "KQED en español",
"description": null,
"taxonomy": "tag",
"headData": {
"twImgId": null,
"twTitle": null,
"ogTitle": null,
"ogImgId": null,
"twDescription": null,
"description": null,
"title": "KQED en español Archives | KQED Science",
"ogDescription": null
},
"ttid": 5184,
"slug": "kqed-en-espanol",
"isLoading": false,
"link": "/science/tag/kqed-en-espanol"
},
"science_39": {
"type": "terms",
"id": "science_39",
"meta": {
"index": "terms_1716263798",
"site": "science",
"id": "39",
"found": true
},
"relationships": {},
"featImg": null,
"name": "Health",
"description": null,
"taxonomy": "category",
"headData": {
"twImgId": null,
"twTitle": null,
"ogTitle": null,
"ogImgId": null,
"twDescription": null,
"description": null,
"title": "Health Archives | KQED Science",
"ogDescription": null
},
"ttid": 41,
"slug": "health",
"isLoading": false,
"link": "/science/category/health"
},
"science_3890": {
"type": "terms",
"id": "science_3890",
"meta": {
"index": "terms_1716263798",
"site": "science",
"id": "3890",
"found": true
},
"relationships": {},
"featImg": null,
"name": "Medical Science",
"description": null,
"taxonomy": "category",
"headData": {
"twImgId": null,
"twTitle": null,
"ogTitle": null,
"ogImgId": null,
"twDescription": null,
"description": null,
"title": "Medical Science Archives | KQED Science",
"ogDescription": null
},
"ttid": 3890,
"slug": "medical-science",
"isLoading": false,
"link": "/science/category/medical-science"
},
"science_4329": {
"type": "terms",
"id": "science_4329",
"meta": {
"index": "terms_1716263798",
"site": "science",
"id": "4329",
"found": true
},
"relationships": {},
"featImg": null,
"name": "Coronavirus",
"description": null,
"taxonomy": "tag",
"headData": {
"twImgId": null,
"twTitle": null,
"ogTitle": null,
"ogImgId": null,
"twDescription": null,
"description": null,
"title": "Coronavirus Archives | KQED Science",
"ogDescription": null
},
"ttid": 4329,
"slug": "coronavirus",
"isLoading": false,
"link": "/science/tag/coronavirus"
},
"science_4368": {
"type": "terms",
"id": "science_4368",
"meta": {
"index": "terms_1716263798",
"site": "science",
"id": "4368",
"found": true
},
"relationships": {},
"featImg": null,
"name": "COVID-19",
"description": null,
"taxonomy": "tag",
"headData": {
"twImgId": null,
"twTitle": null,
"ogTitle": null,
"ogImgId": null,
"twDescription": null,
"description": null,
"title": "COVID-19 Archives | KQED Science",
"ogDescription": null
},
"ttid": 4368,
"slug": "covid-19",
"isLoading": false,
"link": "/science/tag/covid-19"
},
"science_4417": {
"type": "terms",
"id": "science_4417",
"meta": {
"index": "terms_1716263798",
"site": "science",
"id": "4417",
"found": true
},
"relationships": {},
"featImg": null,
"name": "featured-news",
"description": null,
"taxonomy": "tag",
"headData": {
"twImgId": null,
"twTitle": null,
"ogTitle": null,
"ogImgId": null,
"twDescription": null,
"description": null,
"title": "featured-news Archives | KQED Science",
"ogDescription": null
},
"ttid": 4417,
"slug": "featured-news",
"isLoading": false,
"link": "/science/tag/featured-news"
},
"science_5181": {
"type": "terms",
"id": "science_5181",
"meta": {
"index": "terms_1716263798",
"site": "science",
"id": "5181",
"found": true
},
"relationships": {},
"featImg": null,
"name": "health",
"description": null,
"taxonomy": "tag",
"headData": {
"twImgId": null,
"twTitle": null,
"ogTitle": null,
"ogImgId": null,
"twDescription": null,
"description": null,
"title": "health Archives | KQED Science",
"ogDescription": null
},
"ttid": 5181,
"slug": "health",
"isLoading": false,
"link": "/science/tag/health"
}
},
"userPermissionsReducer": {
"wpLoggedIn": false
},
"eventsReducer": {},
"fssReducer": {},
"tvDailyScheduleReducer": {},
"tvWeeklyScheduleReducer": {},
"tvPrimetimeScheduleReducer": {},
"tvMonthlyScheduleReducer": {},
"userAccountReducer": {
"user": {
"email": null,
"emailStatus": "EMAIL_UNVALIDATED",
"loggedStatus": "LOGGED_OUT",
"loggingChecked": false,
"articles": [],
"firstName": null,
"lastName": null,
"phoneNumber": null,
"fetchingMembership": false,
"membershipError": false,
"memberships": [
{
"id": null,
"startDate": null,
"firstName": null,
"lastName": null,
"familyNumber": null,
"memberNumber": null,
"memberSince": null,
"expirationDate": null,
"pfsEligible": false,
"isSustaining": false,
"membershipLevel": "Prospect",
"membershipStatus": "Non Member",
"lastGiftDate": null,
"renewalDate": null,
"lastDonationAmount": null
}
]
},
"authModal": {
"isOpen": false,
"view": "LANDING_VIEW"
},
"error": null
},
"youthMediaReducer": {},
"checkPleaseReducer": {
"filterData": {
"region": {
"key": "Restaurant Region",
"filters": [
"Any Region"
]
},
"cuisine": {
"key": "Restaurant Cuisine",
"filters": [
"Any Cuisine"
]
}
},
"restaurantDataById": {},
"restaurantIdsSorted": [],
"error": null
},
"userAgentReducer": {
"userAgent": "Mozilla/5.0 AppleWebKit/537.36 (KHTML, like Gecko; compatible; ClaudeBot/1.0; +claudebot@anthropic.com)",
"isBot": true
}
}