upper waypoint

To Avoid Prison, Move to One of These Counties

Save ArticleSave Article
Failed to save article

Please try again

Want to avoid prison? Then stay in the Bay Area. That’s one conclusion you might draw from a massive database assembled by the Center on Juvenile and Criminal Justice on the people behind bars in each county.
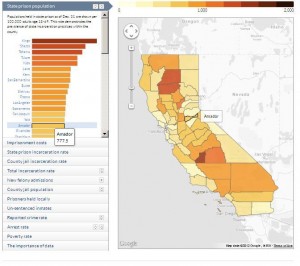
You can see a full interactive version of this map by the Center on Juvenile and Criminal Justic at http://casi.cjcj.org/. Or just click on this map.

As part of its California Sentencing Institute project on Monday, the center unveiled an interactive map that shows what proportion of each county’s population is in state prison, what proportion is in county jail, and what each county is paying to send its residents to California prisons for 2009 and 2010.

Looking at the map, some patterns pop out right away. Notably, the counties in the middle of the state generally put more people behind bars in 2010. That includes Central Valley counties like Kings and Tulare, as well as more northern counties including Shasta and Tehama.

For example, combining state and local prisoners, Kings County locked up 1,386 prisoners per 100,000 residents in 2010, compared to only 233 San Franciscans. Kings County leads all other counties in incarceration, in fact: the runner up, Butte County,  only imprisons 967 people per 100,000.

To what does Kings County owe this distinction? “Somebody has got to be No. 1,” Kings County Deputy District Attorney James Jahn told me. And that was the extent of his insight.

Sponsored

Interestingly, Kings had a slightly lower reported crime rate than the state average that year (1459 serious crimes per 100,000 people, vs 2010 for the state). But it had a slightly higher poverty rate (16% of residents live below the federal poverty line, vs. 12% for the state as a whole).

To get another perspective, I called the Kings County public defender. Or at least I tried to. It turns out there is no public defender in Kings County.  Instead the courts rely on attorneys appointed for the purpose.

By checking the website of the California Public Defenders Association, I found a general correlation; those counties with websites indicating that they have full-time public defenders had a lower incarceration rate than those with no listings for public defenders. Coincidence?

The center released its new database at an interesting time, as the state is in the process of “realignment,” in which the state prisons are accepting fewer convicts, putting more of the responsibility for housing offenders on the counties.

KQED’s Michael Montgomery notes the implications:

There’s been a recent batch of data suggesting that while realignment, broadly speaking, is making progress (25k drop in prison population but not a major increase in local jail pop or crime spike) this is not the case across the board.  Some counties are struggling, some are seeing a spike in jail populations and some are actually sending more offenders to state prison.

lower waypoint
next waypoint