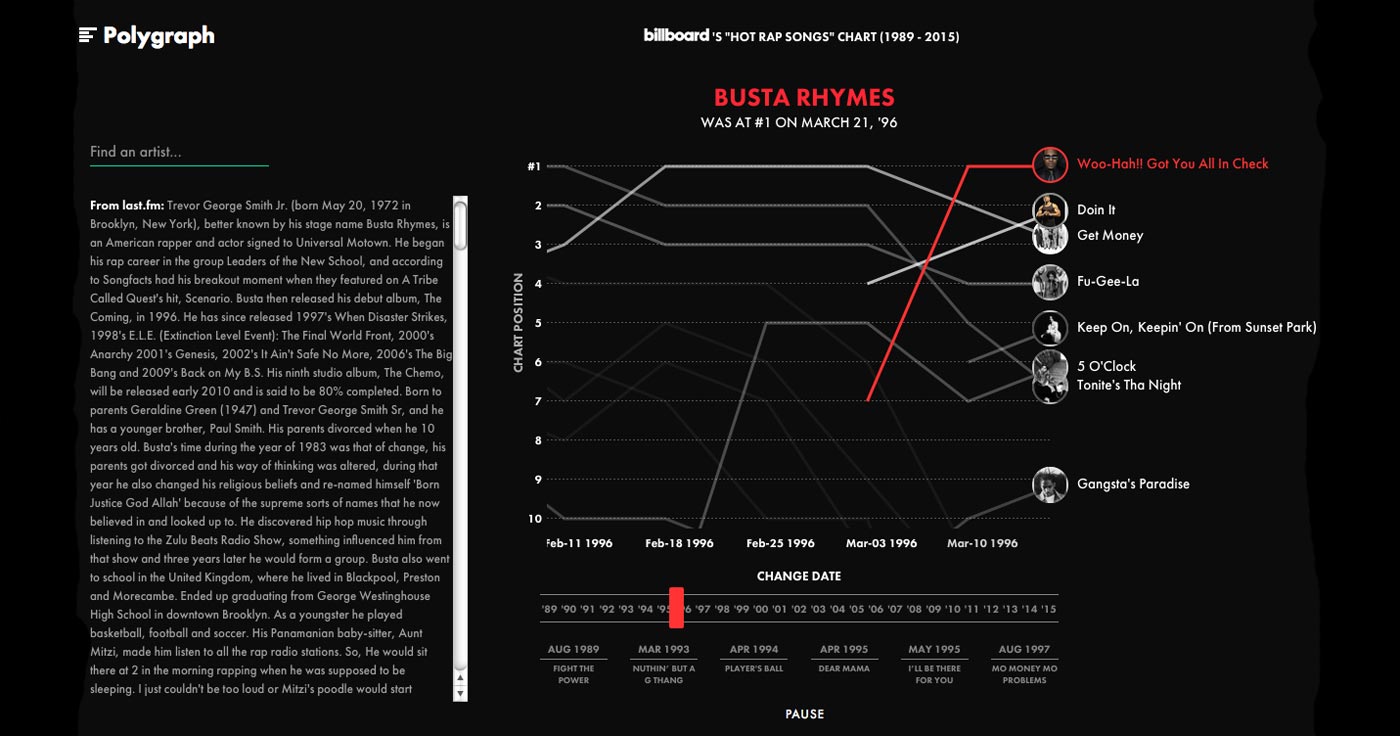
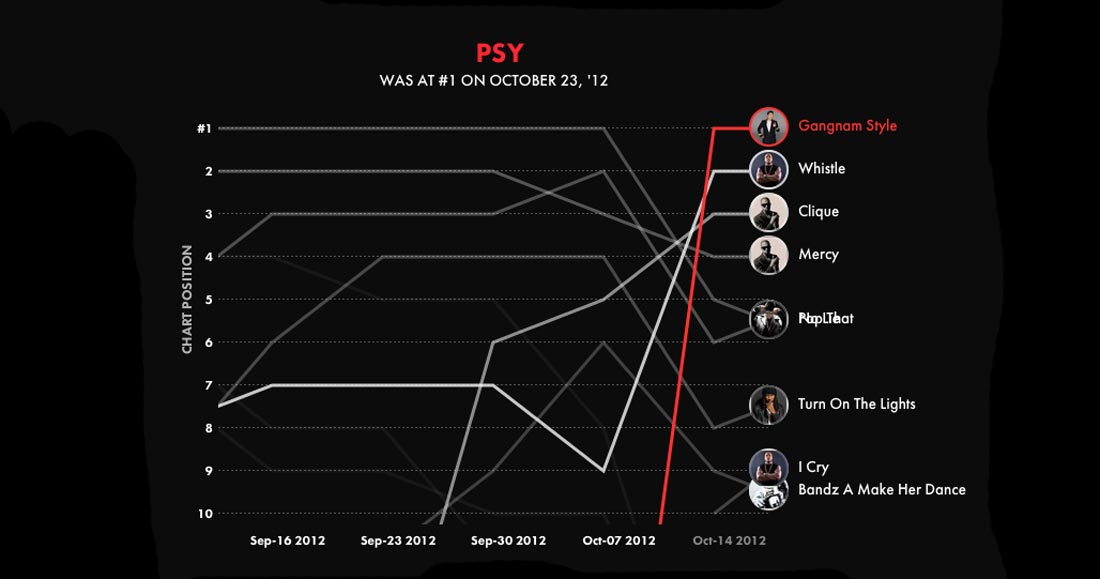
We’ve seen data visualization do great things in hip-hop, but this one has to be experienced to be believed: a running mix of every Top 10 Billboard hip-hop hit since 1995, blended by No. 1 hits and accompanied by a hypnotizing visual graph.
Want to completely lose hours of your day? Click here.
The graph starts out in a three-way battle for No. 1 that anyone listening to rap in 1995 will instantly remember: Notorious B.I.G.’s “Big Poppa,” Dr. Dre’s “Keep Their Heads Ringin'” and 2Pac’s “Dear Mama.” Numbers two through 10 bounce up and down as the graph scrolls along through time; some linger in the middle range for weeks (the Bay Area anthem “I Got 5 on It,” by the Luniz) and some shoot swiftly to the top (“How Do U Want It,” 2Pac) — or simply start right at No. 1 (“I’ll Be Missing You,” Puff Daddy’s tribute to Notorious B.I.G.).

What’s incredible about the graph — and really, it’s something — is that it arranges our memories of certain song’ ubiquity into a visual understanding, complete with hearing the songs in chronological order, their duration dictated by weeks spent at No. 1. Remember 1999-2000, when you couldn’t stop hearing Missy Elliott’s “Hot Boyz” for 18 weeks? In the graph, “Hot Boyz” plays for 54 seconds, all through Y2K, before finally usurped by the Ying Yang Twins’ “Whistle While You Twurk.”


