Feeling a bit dry lately? It's not just your imagination.
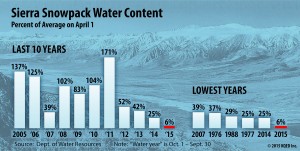
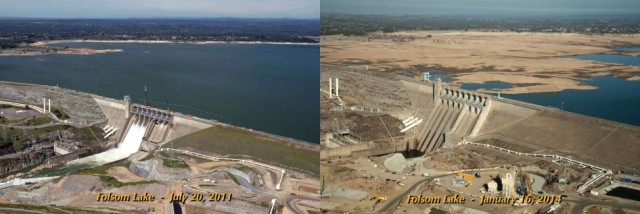
California is mired in its fourth year of historic drought, with snowpack in the Sierra Nevada -- which supplies about a third of the state's water -- at 6 percent of the long-term April average.
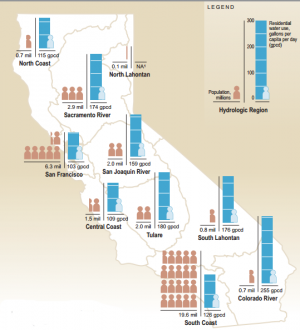
 From a grassy mountain meadow usually blanketed with feet of snow, Gov. Jerry Brown on Wednesday observed the dismal snow survey results before announcing California's first ever mandatory statewide water reductions. The executive action mandates the state’s 400 local water supply agencies, which serve roughly 90 percent of California residents, to reduce urban (non-agricultural) water consumption by 25 percent of 2013 levels over the coming year. The reductions will likely vary by community, based on significant differences in per capita water consumption from region to region. Keep in mind, though, that residential water use is just a small fraction of the state's total water consumption -- with roughly 80 percent of all water resources used for agriculture, and the remainder split between residential and commercial/industrial uses.
[The NY Times produced an interactive map of winter and summer water use rates in various cities and water districts throughout California].
But that begs some important questions: namely, how much water does the average Californian actually consume and what would a 25 percent reduction look like?

