Drought? What drought?
A series of powerful winter storms has restored California's once-withering snowpack to levels well above average, with most of the state's reservoirs now filled at or near capacity.
The suddenly swollen state of California's reservoirs made big news in mid-February when nearly 200,000 people living near Lake Oroville in Butte County were evacuated after the reservoir reached capacity and the dam's spillway failed.
The recent inundation of wet weather makes it's easy to forget that California was very recently mired in a historic five-year drought. And even while epic levels of rain and snow continue to pummel much of the state, the California Water Resources Control Board voted unanimously on Feb. 8 to extend current water conservation rules through September, a nod to the fickle weather patterns of recent years and the still diminished groundwater levels in areas of the agricultural-heavy Central Valley.
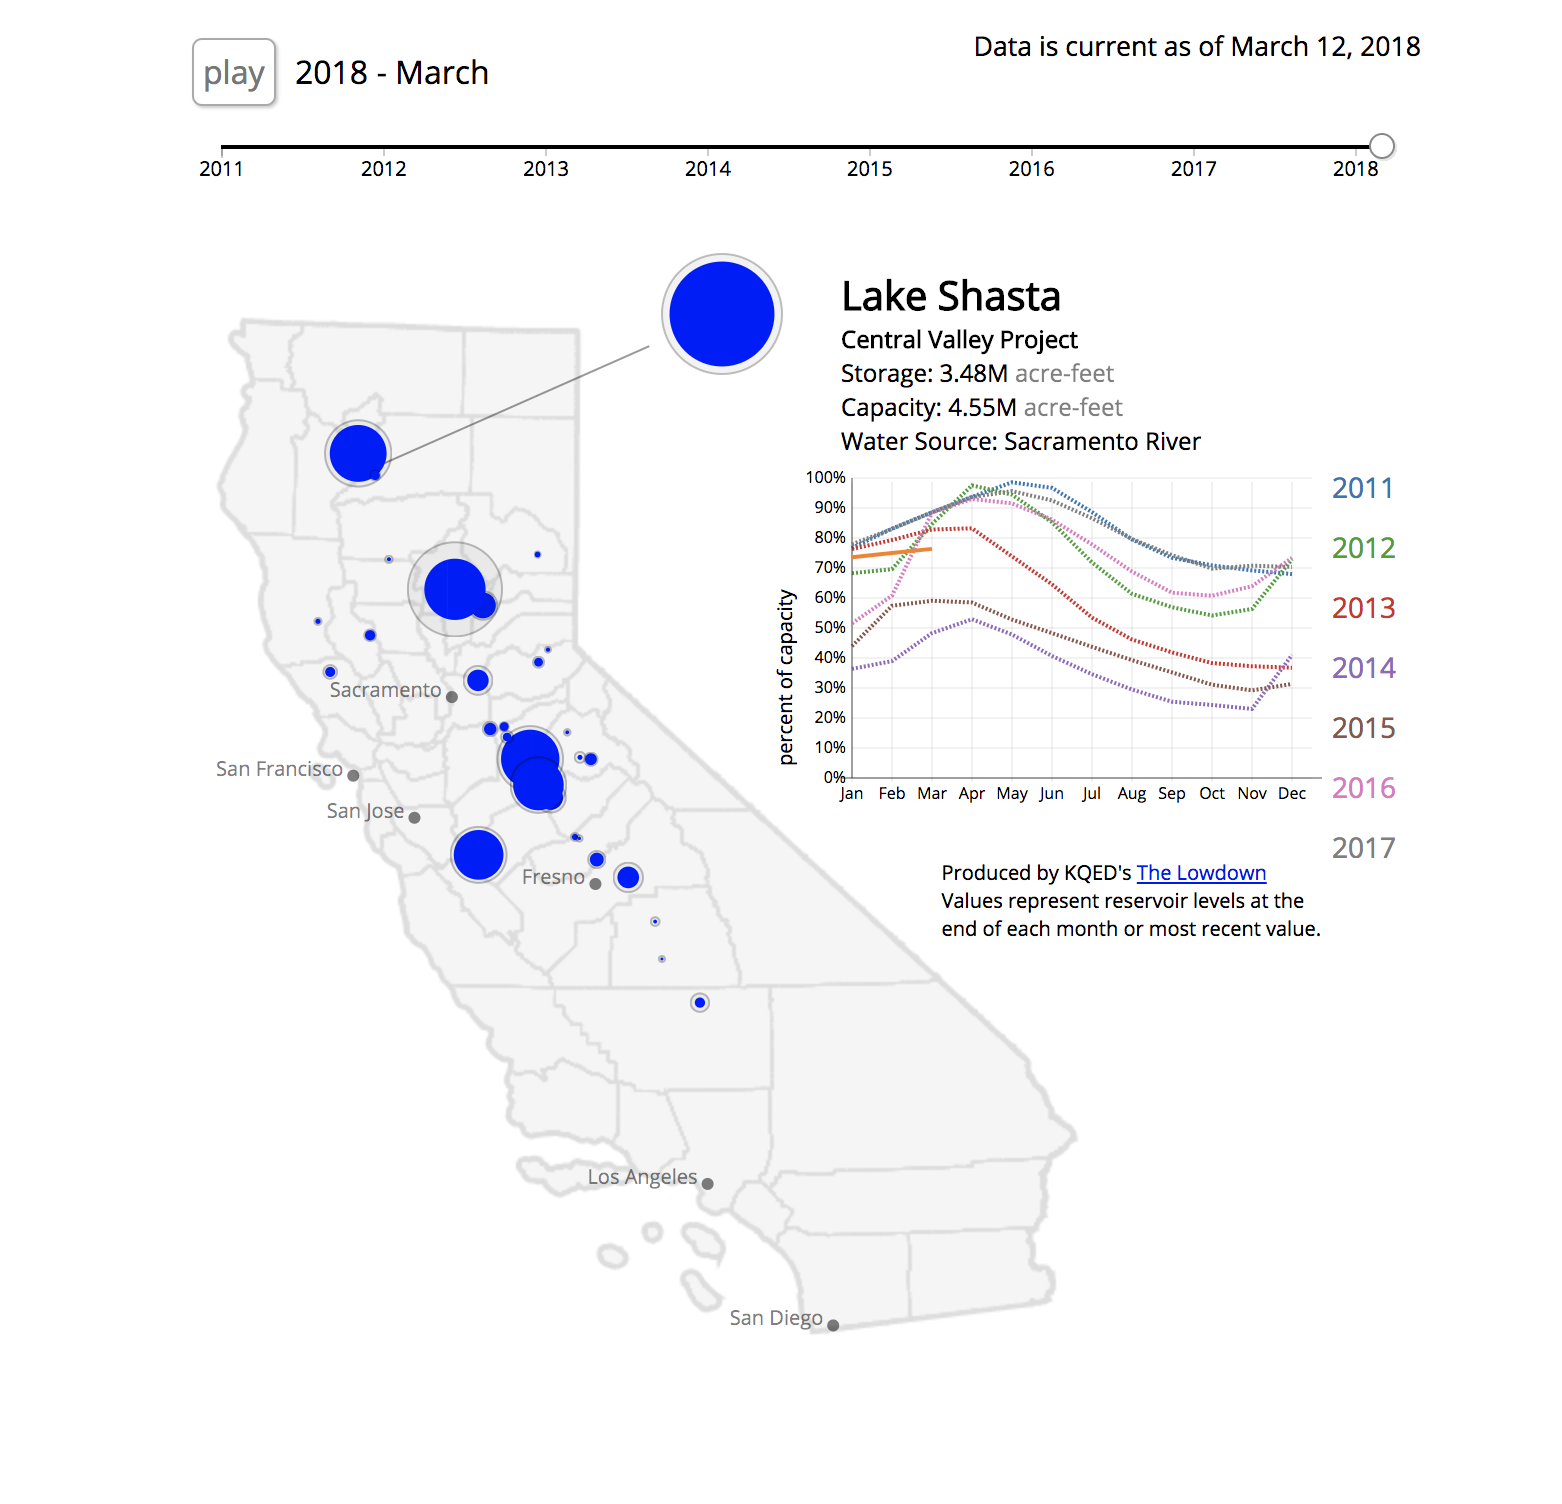
The map below shows fluctuations since 2010 in California's 30-largest reservoirs, using CA Department of Water Resources data.


