Bicyclists and pedestrians beware: San Francisco’s major commercial corridors can be lethal.
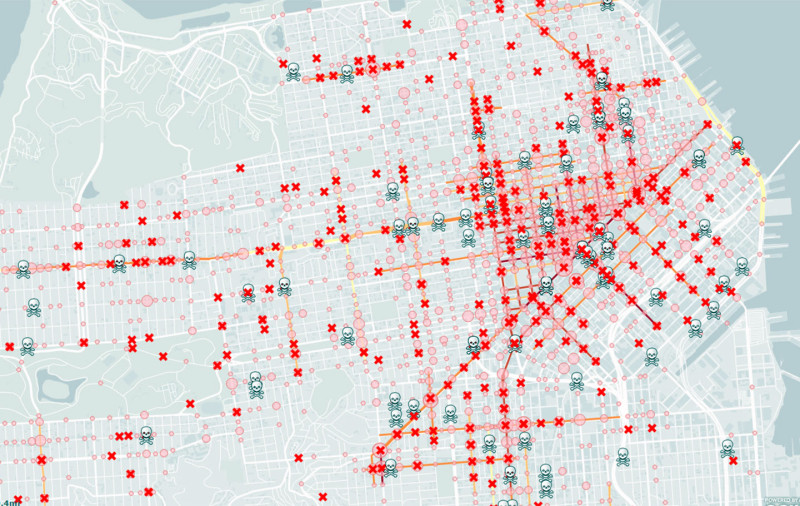
Surprised? Probably not. But now you can see that reality in startling detail on the city’s interactive maps, which show exactly where thousands of people were hurt or killed when they were hit by cars.
The maps are products of the new “Vision Zero” policy agenda, which the city adopted in early 2014 in an effort to make the streets safer following a spate of pedestrian deaths. The maps draw from data that the California Highway Patrol collected between 2005 and 2011 that city agencies compiled and analyzed.
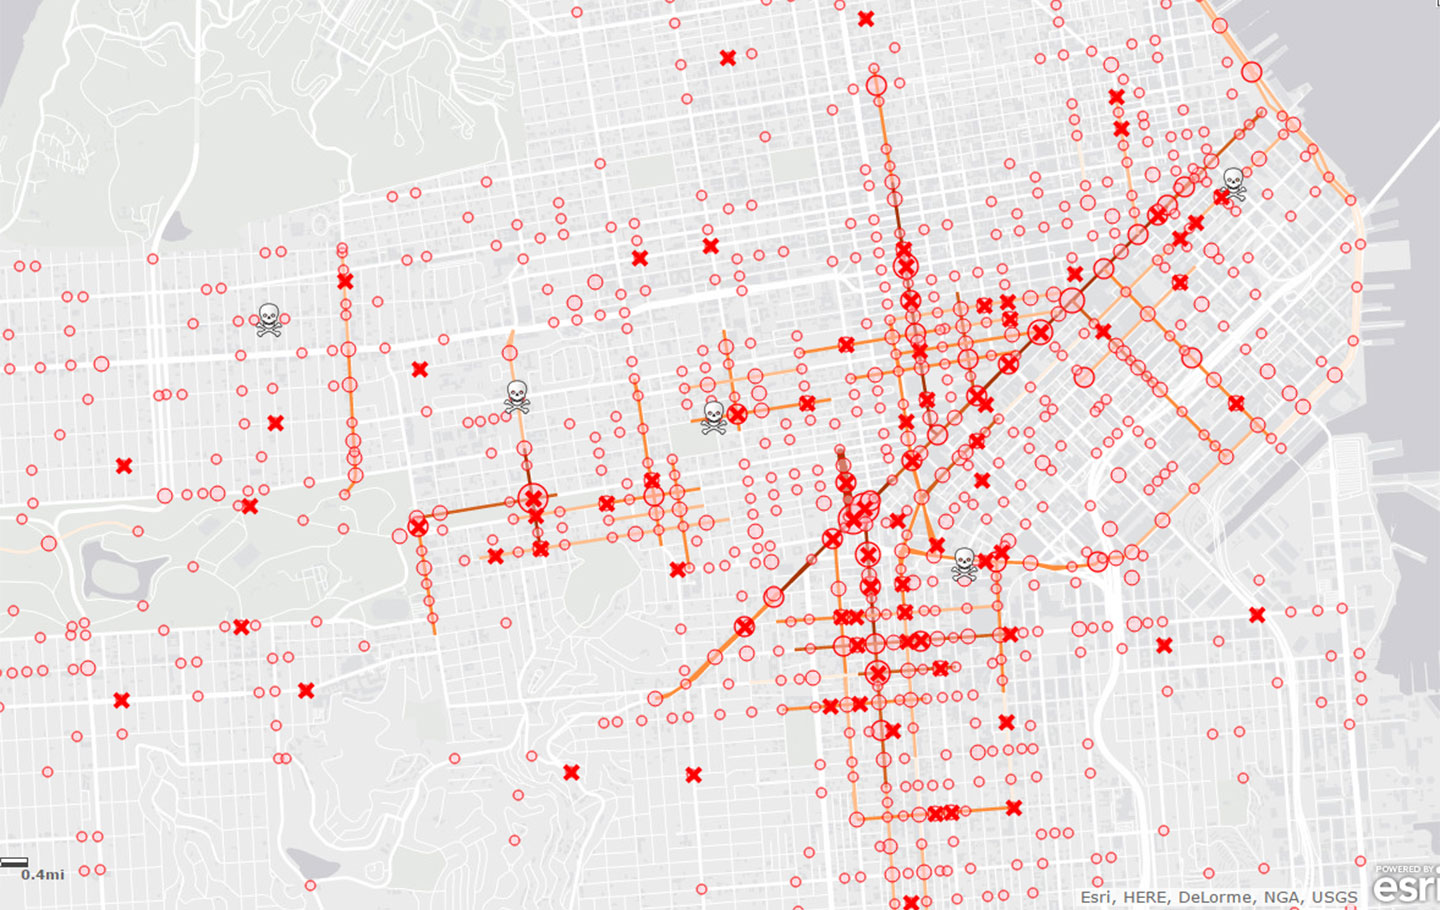
The interactive maps show exactly how many people were hurt at a given intersection. (Skull-and-crossbones represents a death, “X” represents a severe injury, and larger circles mark intersections where accidents frequently occurred.)

Cyclists: Major injuries were clustered along Polk Street in the Tenderloin, as well as Valencia Street in the Mission District. The intersection of Market Street and Octavia Boulevard was especially dangerous, and serious collisions occurred in the Panhandle neighborhood, too. (Data from 2007—2011)
