A Great Depression federal home-loan policy that ranked the desirability of neighborhoods based on their racial makeup may still be affecting the health of the residents who live there today, a new study suggests.
Asthma Rates Higher in California's Historically Redlined Communities, New Study Finds
Researchers at UC Berkeley and UCSF examined health statistics in eight California cities that were heavily impacted by redlining — a tactic used by government officials to justify discriminatory mortgage-lending policies in predominantly minority neighborhoods. The study found that current residents of those neighborhoods are more than twice as likely as their peers to visit emergency rooms for asthma.
“What it suggests is that real estate policy that was enacted over 80 years ago, enforced in part on the basis of race, both shaped our neighborhoods and may still be impacting respiratory health outcomes today,” said Anthony Nardone, a medical student in the UC Berkeley-UCSF Joint Medical Program, who led the analysis. “It’s the first study, to our knowledge, that actually assesses the relationship between historic residential redlining and current health outcomes.”
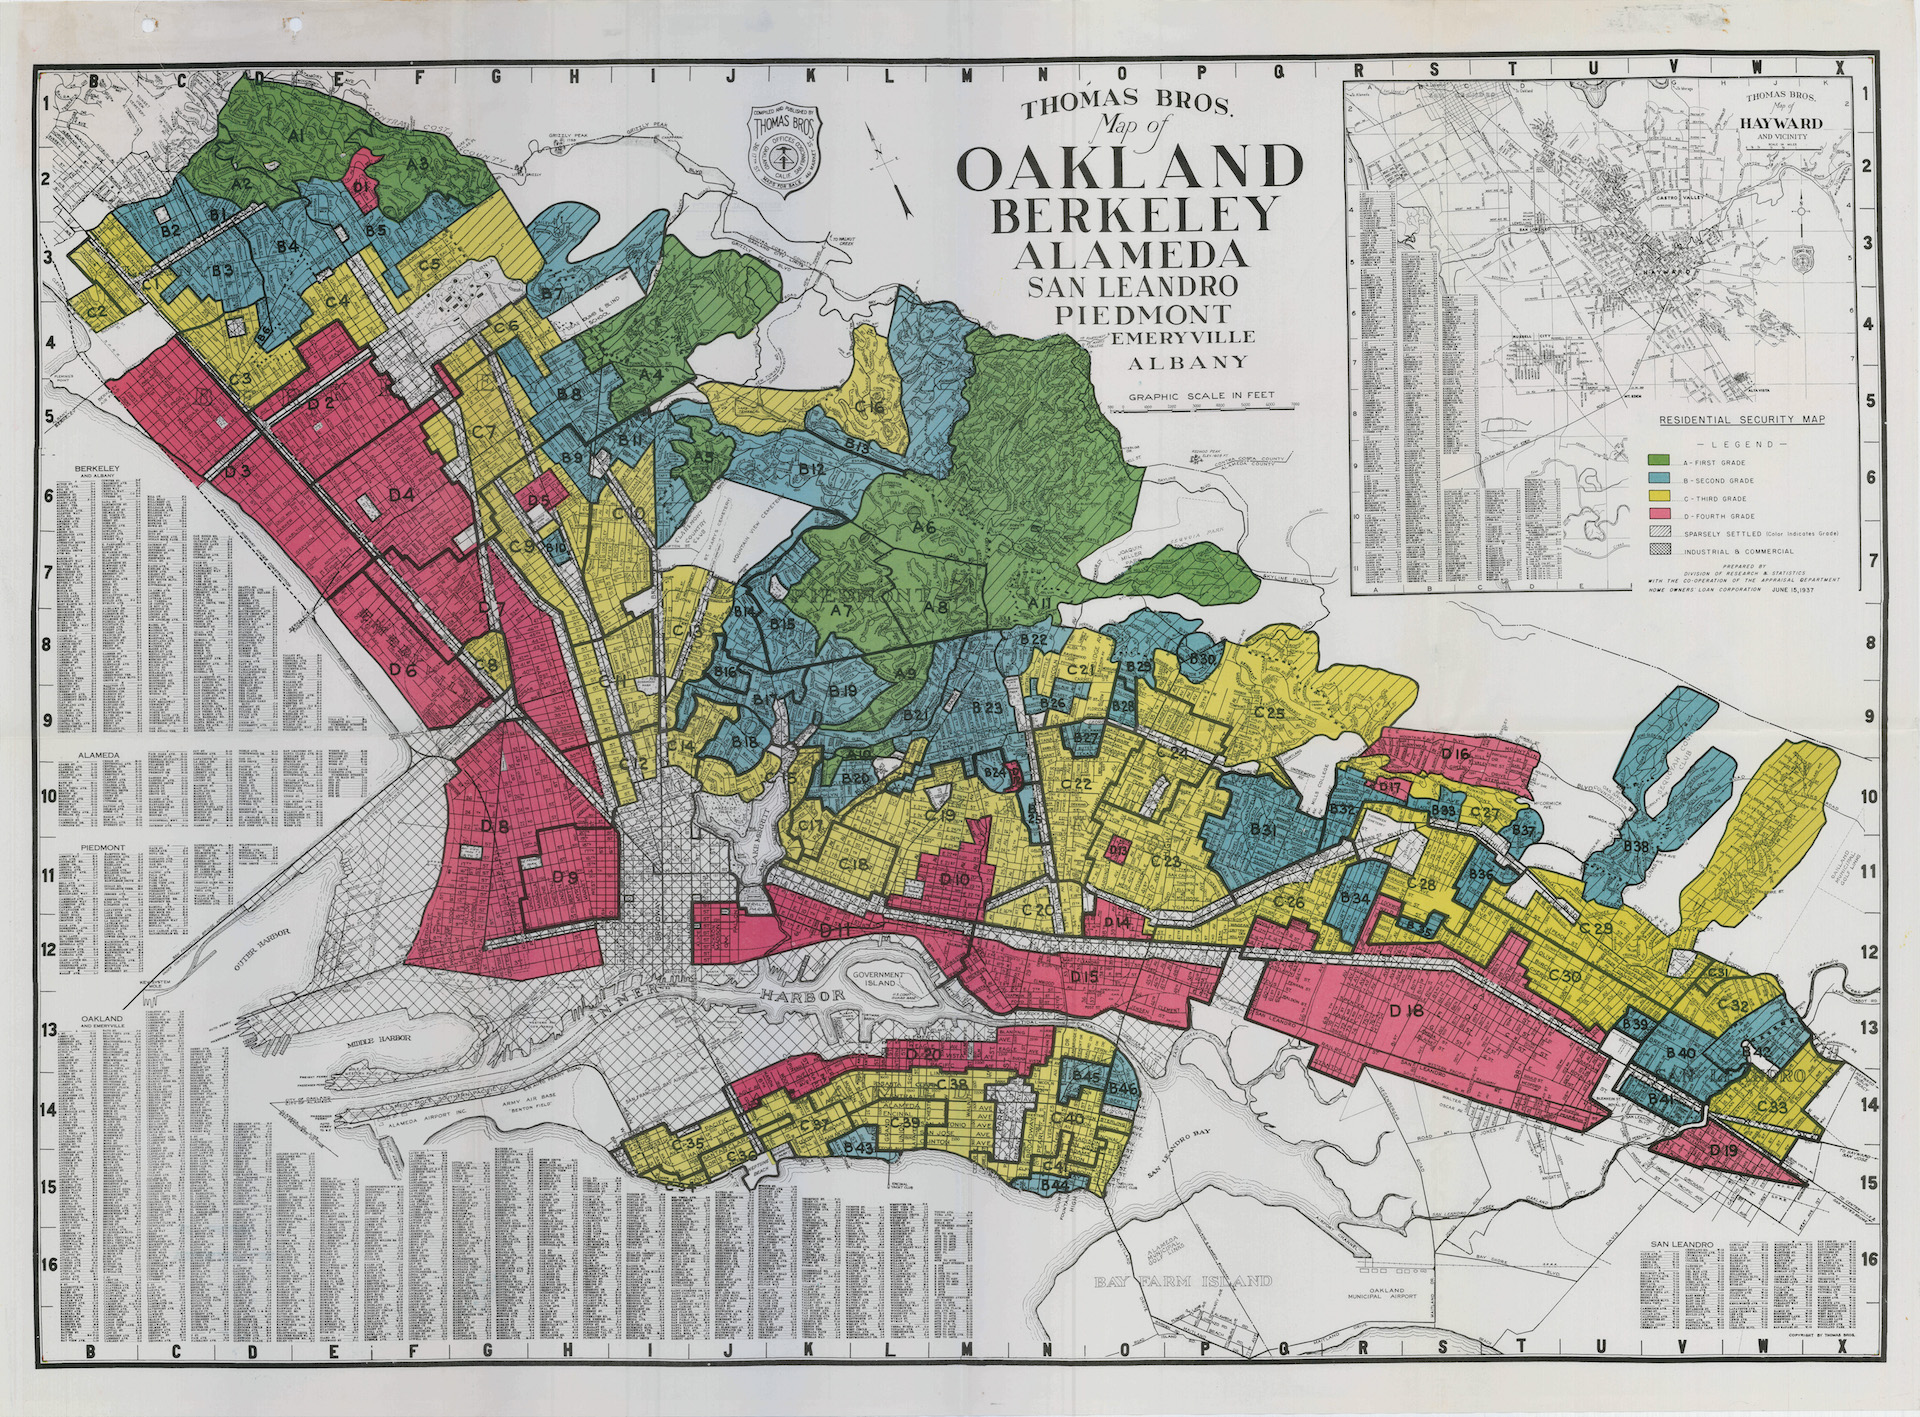
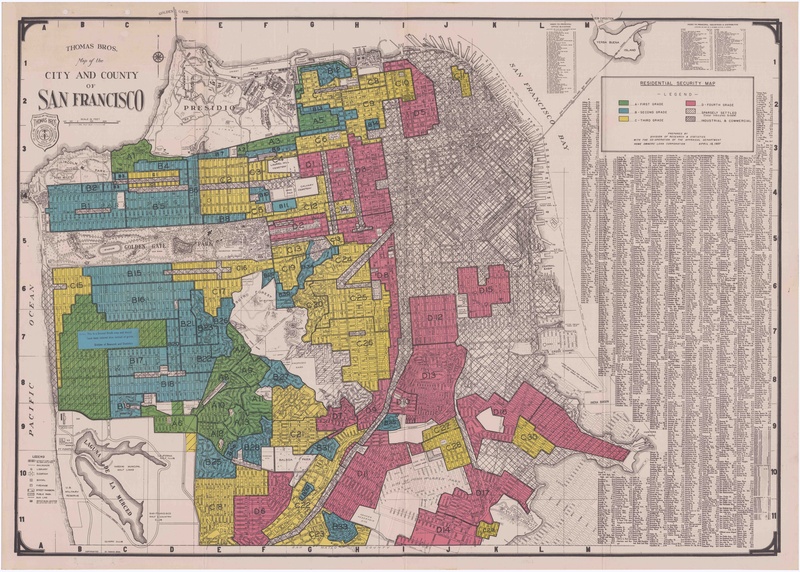
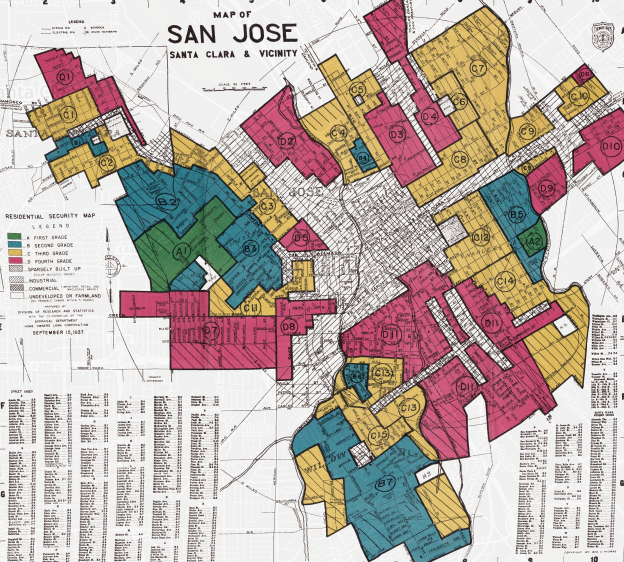
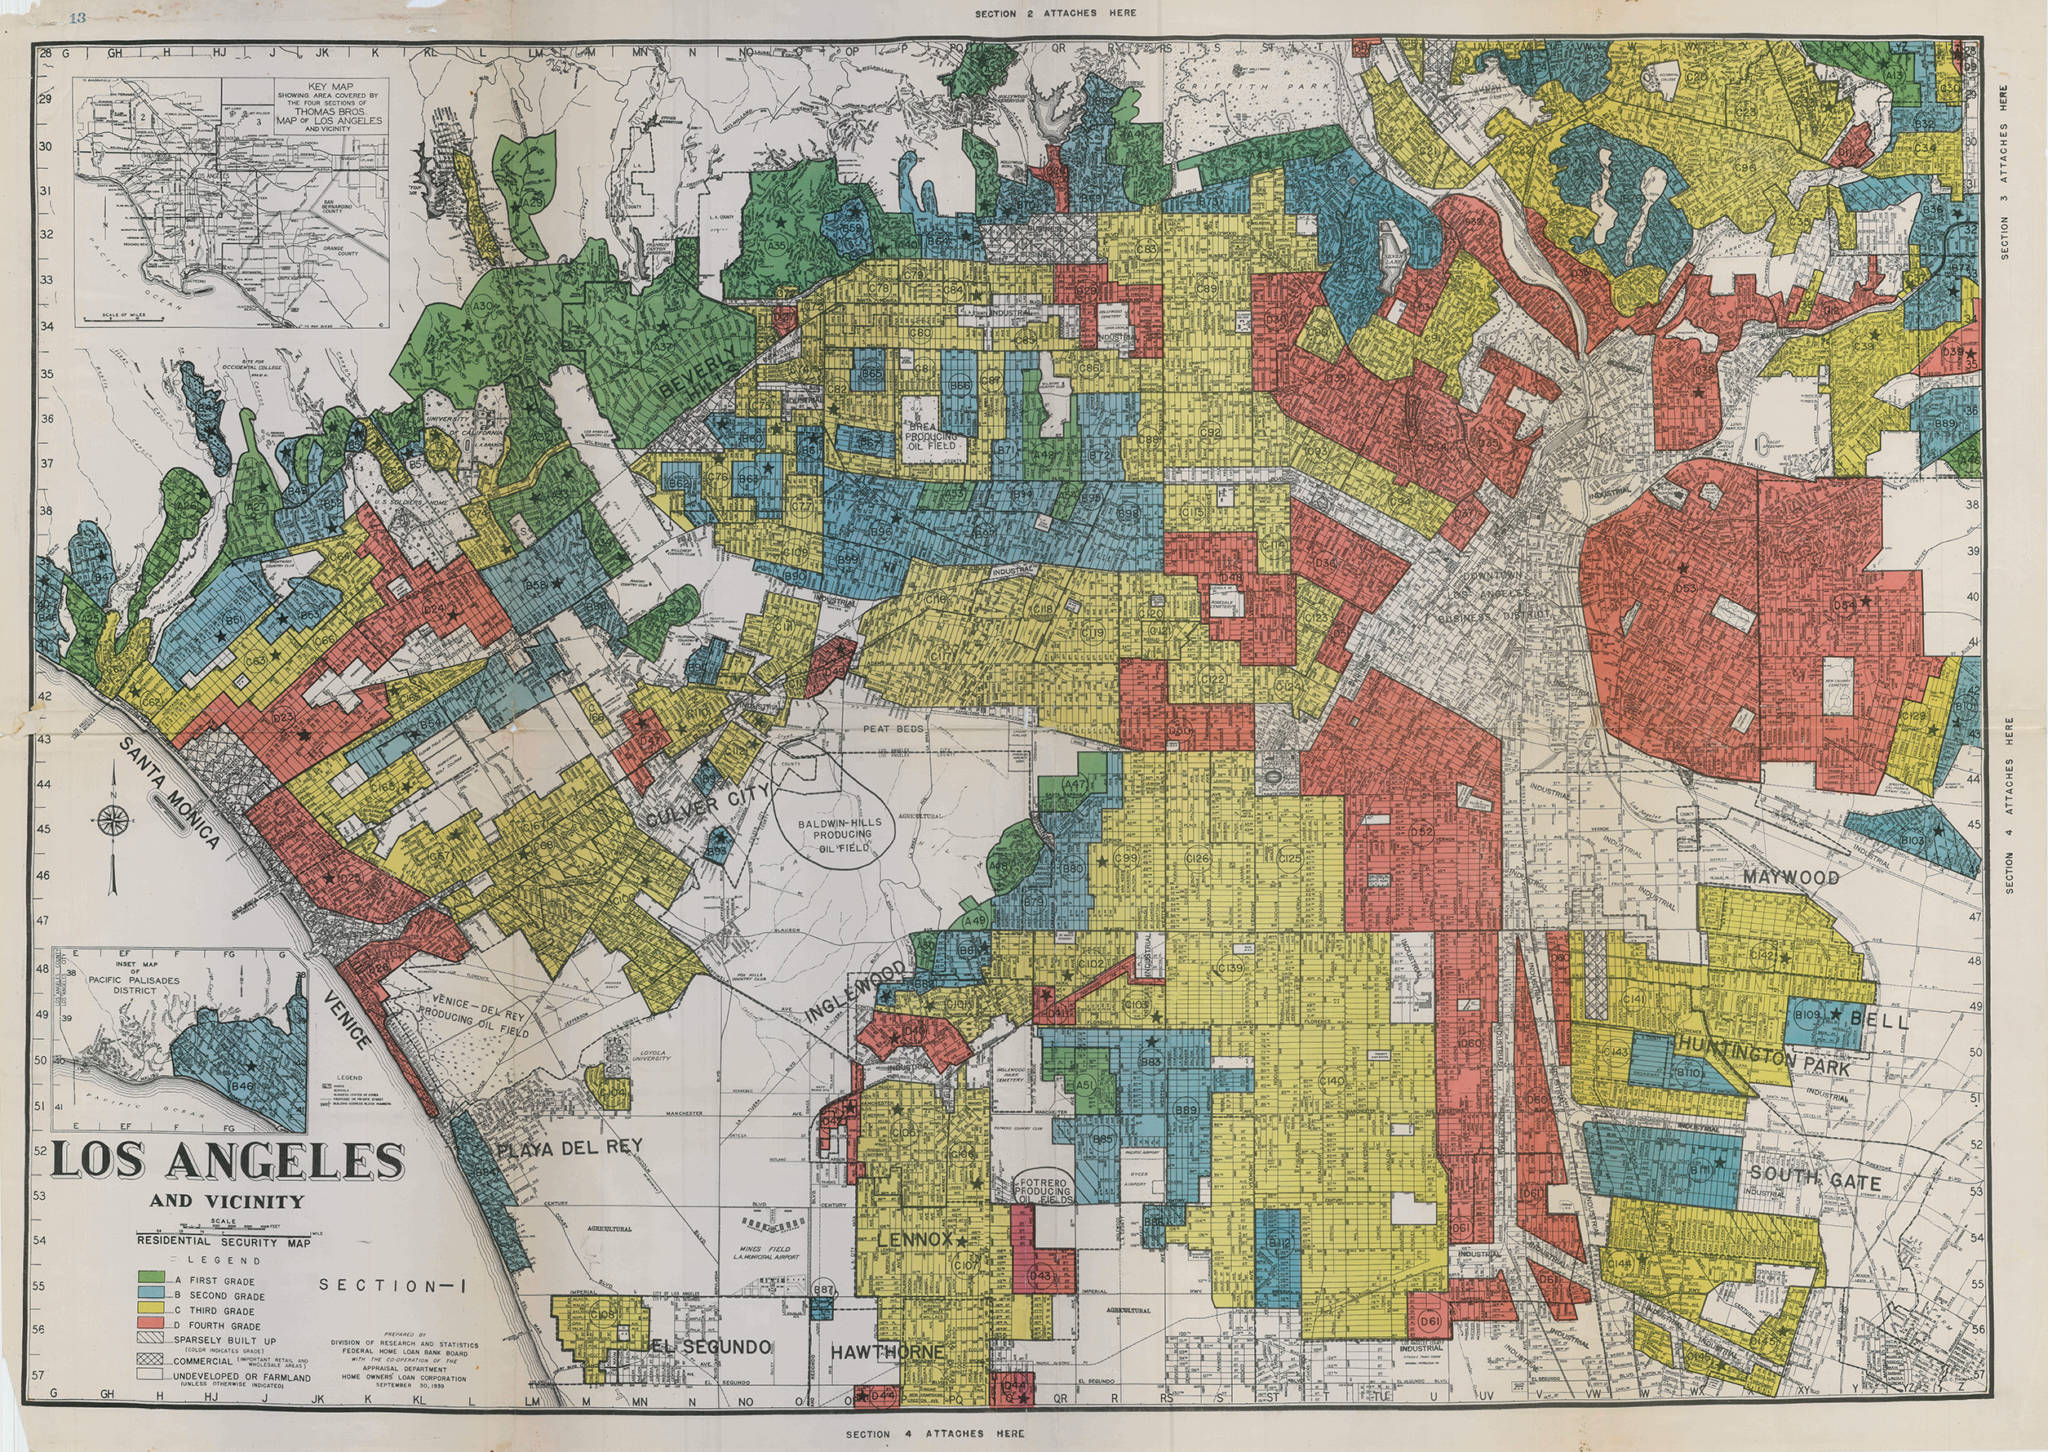
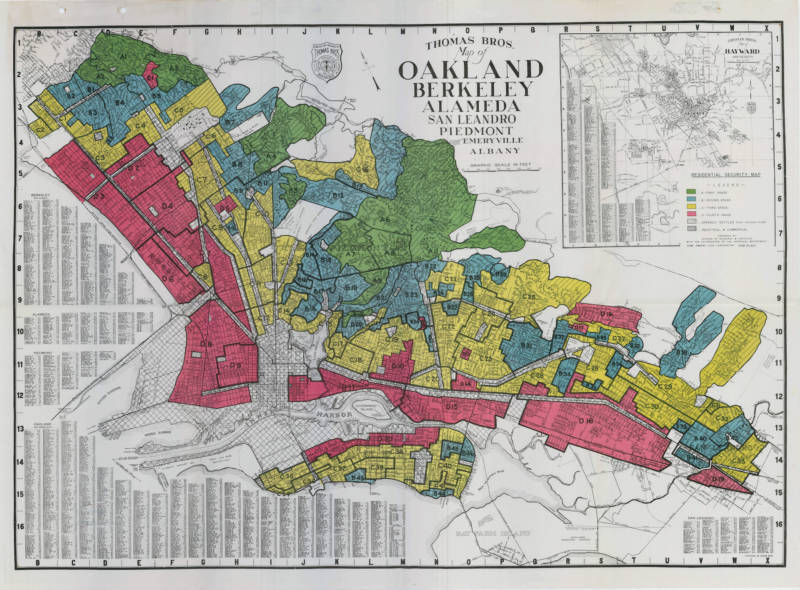
Nardone used historic redlining maps to identify census tracts in San Francisco, San Jose, Oakland, Sacramento, Stockton, Fresno, Los Angeles and San Diego that government officials had once identified as “high risk” (red) and “low risk” (green) neighborhoods in terms of loan security. He then compared current air quality and health outcome data from each of those tracts, using the CalEnviroScreen 3.0 database, and found that current residents in the redlined communities — those considered “high risk” — visited the emergency room for asthma-related complaints 2.4 times more often than those in nearby “low risk” neighborhoods.
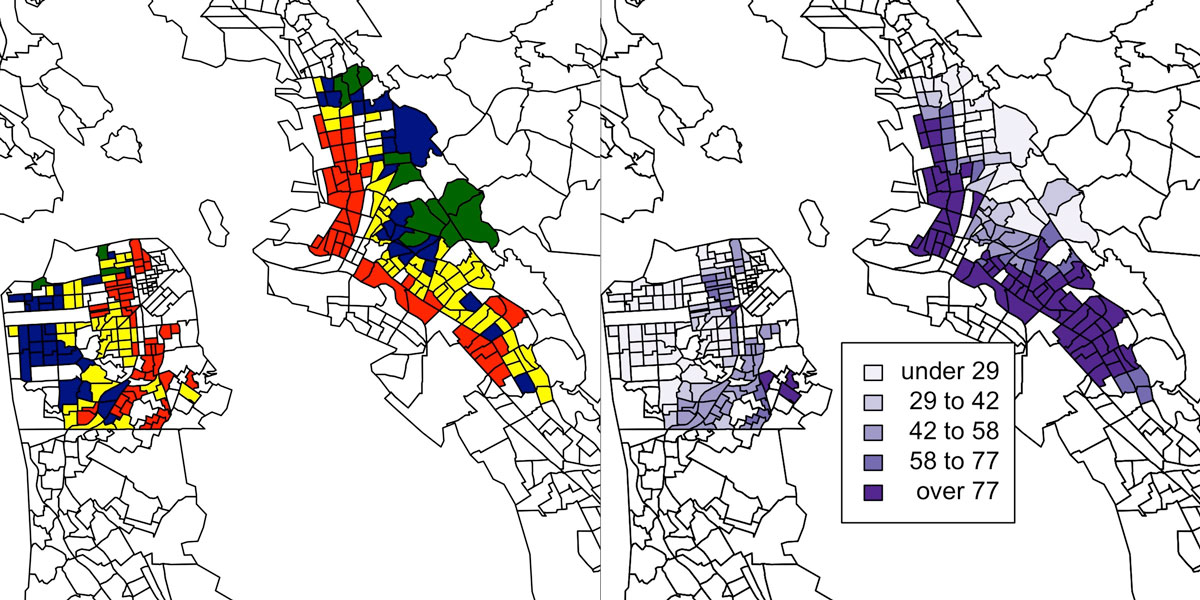
That asthma-health disparity is driven in part by excessive exposure to ambient air pollution, said Nardone, noting that historically redlined neighborhoods often have significantly higher levels of diesel particulate matter in the air. But that’s not the only factor at play, he added, citing generational poverty and elevated levels of “psychosocial stress” caused by everything from living in environments with higher crime rates to a lack of access to decent, affordable health care.
Redlining started as official government policy during the Great Depression. The Home Owners’ Loan Corp. (HOLC), established by Congress in 1933 as part of President Franklin Roosevelt’s New Deal, was intended to help stem the urban foreclosure crisis sweeping the country. The government-sponsored agency refinanced more than a million homes, issuing low-interest, long-term loans to scores of new homeowners across the nation and spurring a dramatic increase in home ownership in the following decades.
But only for some.
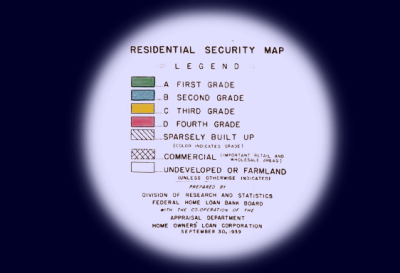
To identify neighborhoods deemed safe investments, HOLC gathered reams of local data to draw up “residential safety maps” in some 240 cities across the country. Neighborhoods were classified into one of four categories based on “favorable” and “detrimental” influences, including “threat of infiltration of foreign-born, negro, or lower grade population.”
These designations were for decades used to deny home loans and other forms of investment to these communities, stunting generational wealth and furthering racial segregation.
“Though these discriminatory lending practices are now illegal, and gentrification has affected the demographics of some redlined neighborhoods, they remain largely low income and have a higher proportion of black and Hispanic populations than non-redlined communities,” Nardone said.
Private banks quickly adopted the government’s identification system, commonly denying home loans to residents in neighborhoods considered risky. The color coding of maps became a verb: to redline a community was to mark it as undesirable and not worthy of investment.
Although officially prohibited by the Fair Housing Act of 1968, the practice of neighborhood delineation based on race and class had a lasting impact, depriving certain neighborhoods of essential resources.
“Our study shows that, even though a policy gets eliminated or is recognized to be a poor choice, its effect can have impacts even many decades later,” said Neeta Thakur, an assistant professor of medicine at UCSF and Nardone’s adviser. “We need to use that information to help us inform our current policies and thinking about what potential ramifications are down the road.”
More subtle forms of redlining continue, however, as evidenced by recent discriminatory loan practice settlements and issues of “retail redlining,” in which businesses avoid setting up shop in neighborhoods deemed undesirable.
Below are some of the original HOLC maps and recreated interactive versions, which use data collected by the University of Maryland’s T-Races project (click on individual tracts to read original assessments for each neighborhood).
