Episode Transcript
This is a computer-generated transcript. While our team has reviewed it, there may be errors.
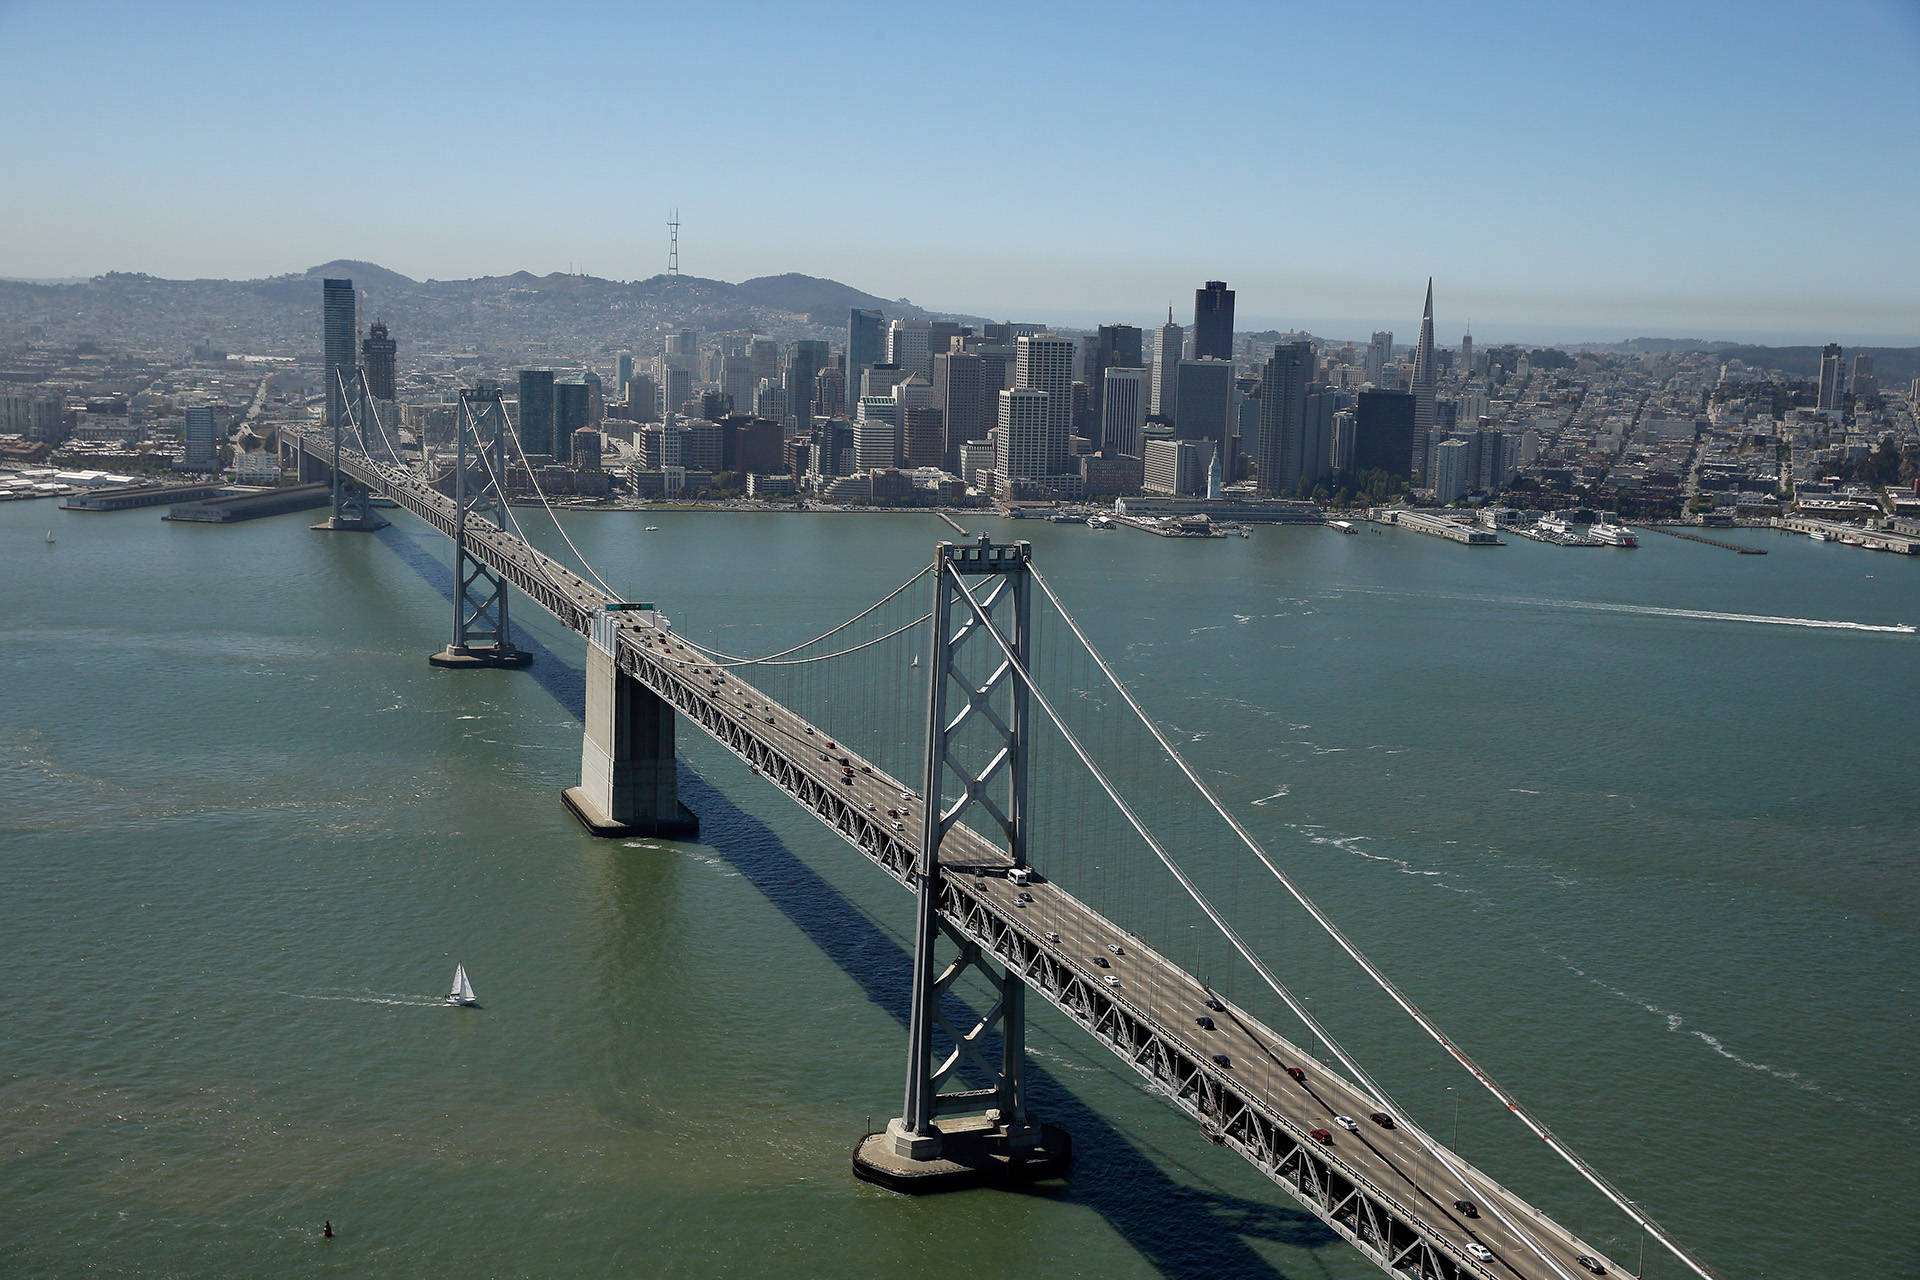
Olivia Allen-Price: If you spend any time along the shores or on the water inside the Golden Gate, you may have thought the bay looks less ocean blue and more olive green these days. Justin Hartung definitely thinks so.
Justin Hartung: Yes, I noticed it driving across the bridge mostly. I live right here in Emeryville, so the water, especially right here by the bridge, is really green some days.
Olivia Allen-Price: Justin grew up in Oakland’s Montclair neighborhood.
Justin Hartung: Moved to New York around 1992 for college.
Olivia Allen-Price: And when he moved back a couple years ago, the bay itself looked very different to him.
Justin Hartung: I remember it being much more blue, so I wondered if that was a thing or if I was just remembering things incorrectly.
Olivia Allen-Price: This is Bay curious, the show where we answer listener questions about the San Francisco Bay area. Today on the show, we’ll find out if Justin’s observations hold water. We’ll learn what makes water appear different colors, and meet some scientists who have been studying this very question for decades. This story first aired in 2019. I’m Olivia Ellen Price. We’ll get to it right after this.
Justin Hartung brought his question to Bay. Curious. You selected it in a public voting round, and now reporter Amanda Font heads out in search of answers about the colors of the bay.
Amanda Font: Incremental change is hard to see when you’re looking at something every day, like how your hair looks just as long today as it did yesterday. Even though it has grown a little, you could look at an old photo of yourself to see a difference, but that won’t work. If we’re looking for subtle color changes in the bay, the only way to know for sure is through data. And lots of it.
Jim Cloern: Many parts of the bay are very different today than they were 43 years ago.
Amanda Font: Luckily, someone has been collecting that data.
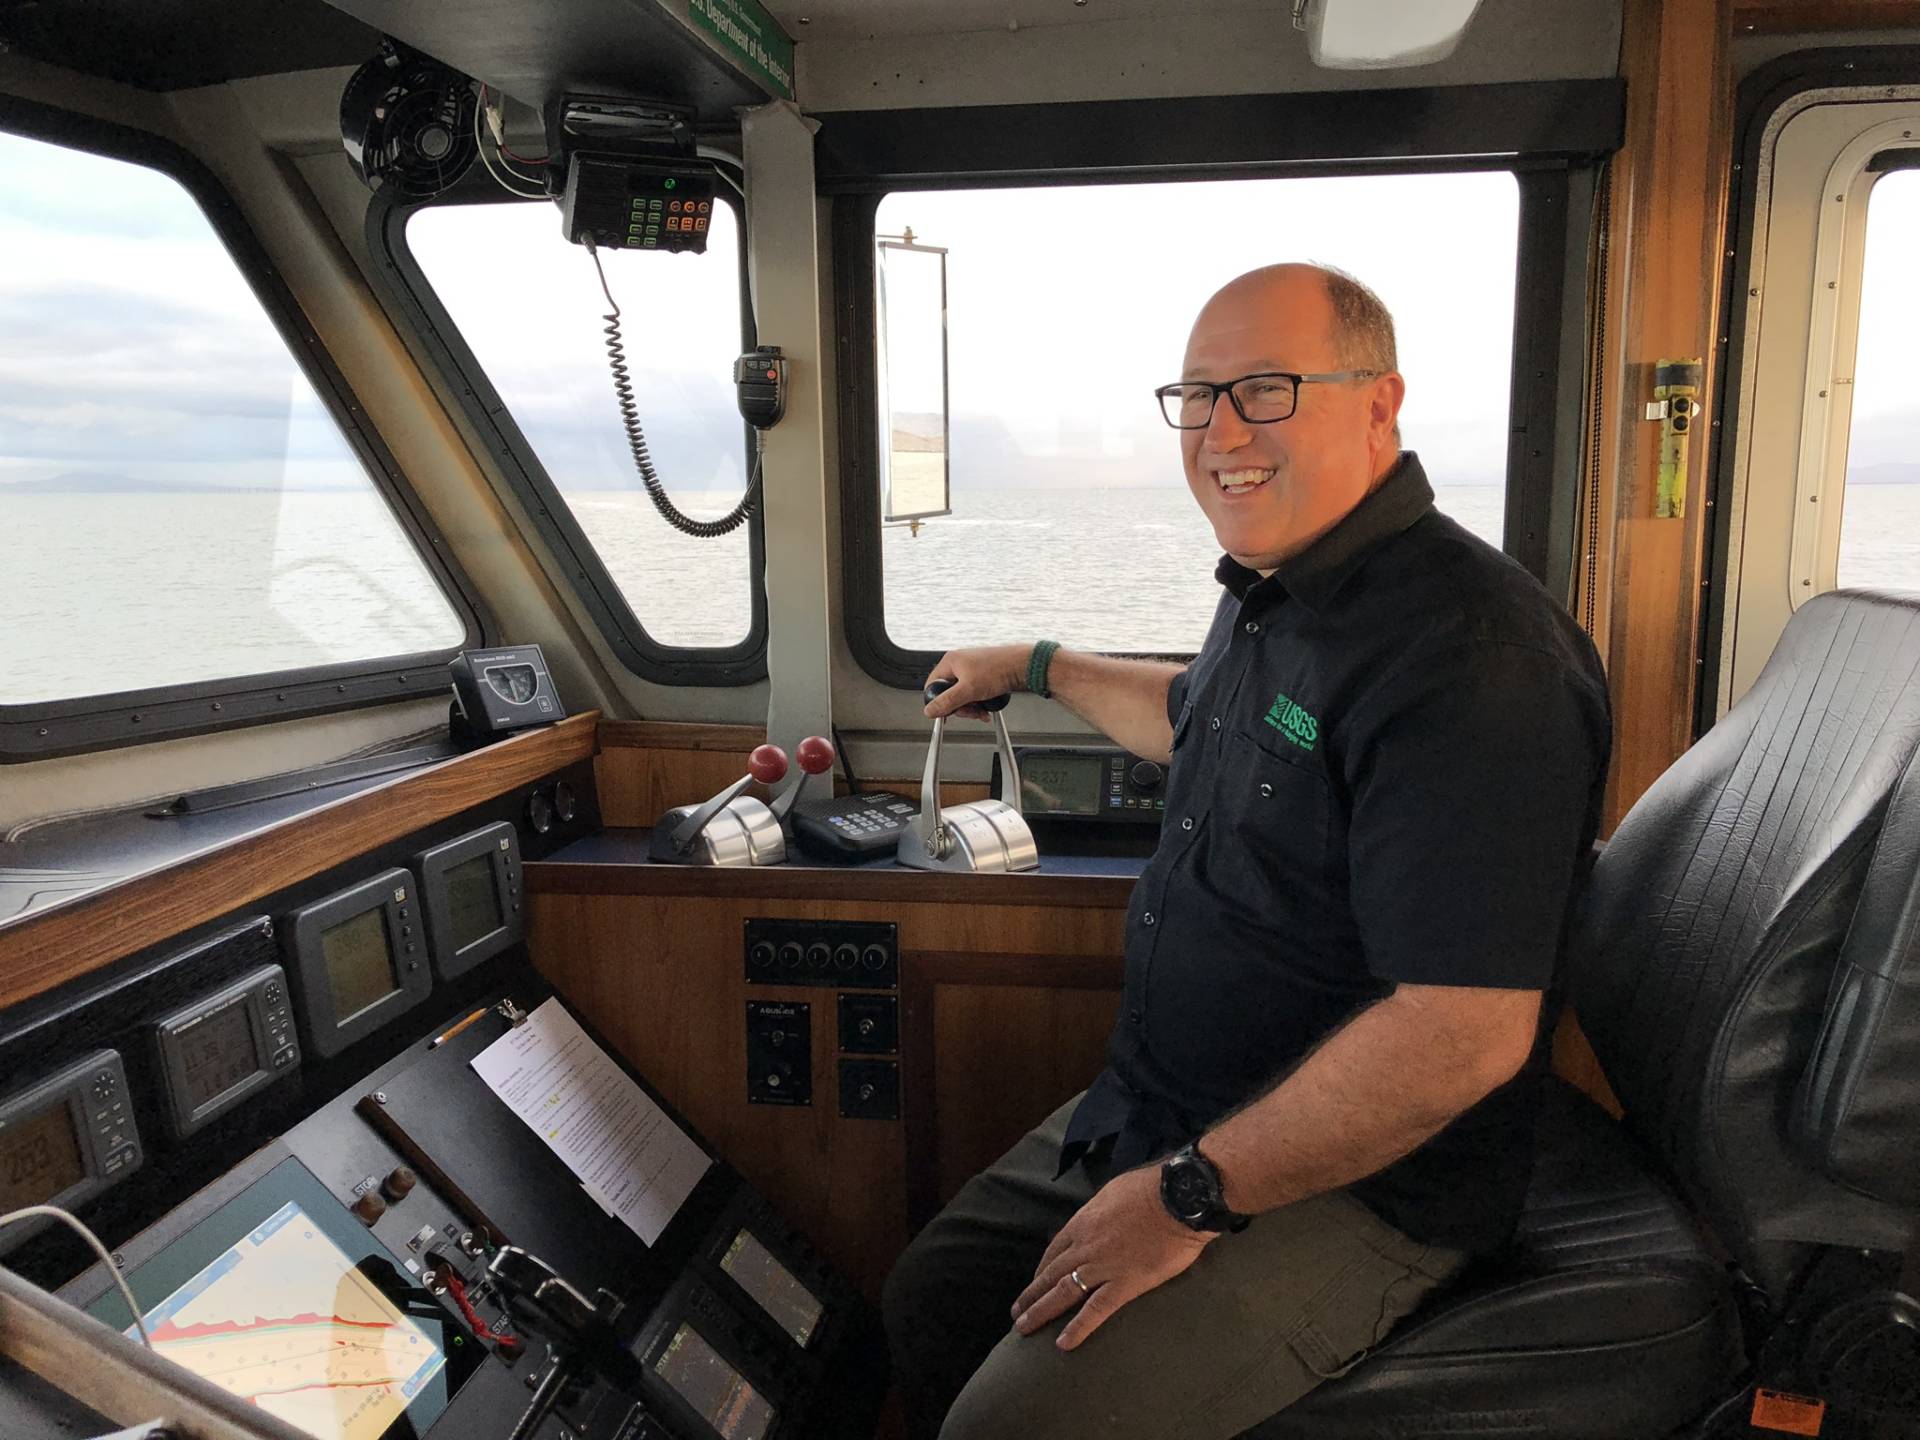
Justin Hartung: My name is Jim Cloern. I’m trained as a lake biologist, but I’ve spent my entire career working in San Francisco Bay.
Amanda Font: Jim is recently retired from the U.S. Geological Survey, but he spent more than four decades studying how the bay is influenced by human activities, and he’s seen a lot of change. I asked Jim if he could answer Justin’s question just straight up. Is the Bay really greener?
Jim Cloern: Yeah. Okay. But the color of water is a pretty complicated subject.
Amanda Font: All right, kids, buckle up for some science.
Jim Cloern: When I think about the color of water in California, the first thing I think about is Lake Tahoe.
Amanda Font: You’ve probably seen those bumper stickers that say Keep Tahoe Blue.
Jim Cloern: Well, what does that mean? Lake Tahoe is pretty much snow melt is pretty close to pure water. It doesn’t have much in it.
Amanda Font: And if you held up a drop and looked at it, it would pretty much be clear. It’s light that influences how we see the color of water.
Jim Cloern: So water absorbs red and green and orange and yellow and violet, but it doesn’t absorb blue.
Amanda Font: Blue light has a much shorter wavelength. So unlike the colors of light with longer wavelengths, same red or orange, it doesn’t snake through the water molecules as easily. It bangs into that. And where they hit the molecules. The blue light waves scatter. And your eye perceives more blue light.
Jim Cloern: And so when sunlight penetrates into a lake like Lake Tahoe, all of these other colors are absorbed by the water. But what’s left behind is the blue.
Amanda Font: This light scattering is also the reason the sky looks blue. So if when you were a kid, your mom or dad told you the sky is blue because it reflects the ocean, and the ocean is blue because it reflects the sky? Yeah, they probably just didn’t know the answer. Or you were asking too many questions. So in the bay, when you see any other color besides blue, you’re really seeing particles.
Jim Cloern: Particles and other colors. There are living particles and there are non-living particles. The non-living particles are mostly clay particles that come from soils.
Amanda Font: This sediment gets into the water through erosion runoff after it rains, and via the multiple rivers that flow into the bay. Currents churn up the sediment, which can make the water look brown.
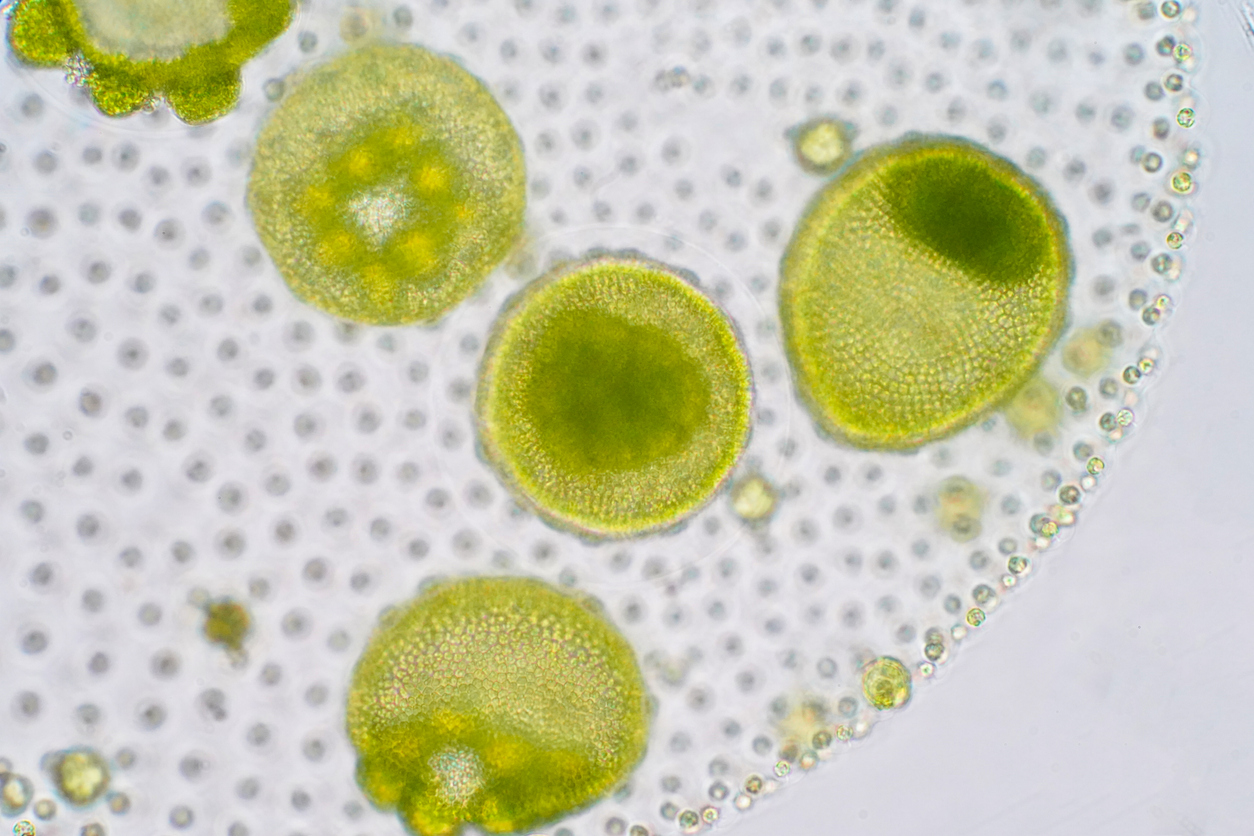
Jim Cloern: The living particles are microscopic algae. Phytoplankton. The phytoplankton have the same chlorophyl that land plants have that makes them green.
Amanda Font: It’s these phytoplankton that give the water a greenish hue.
Jim Cloern: Now the question of has there been a long term trend of greenness in the bay? It’s it sounds like a simple question, but it’s not as simple and straightforward as you would think, because we have all these sources of variability.
Amanda Font: The bay isn’t a static thing. It changes seasonally. Day to day, hour to hour.
Jim Cloern: And so if there’s a long term trend, all of that variability makes it hard to detect a long term pattern of change.
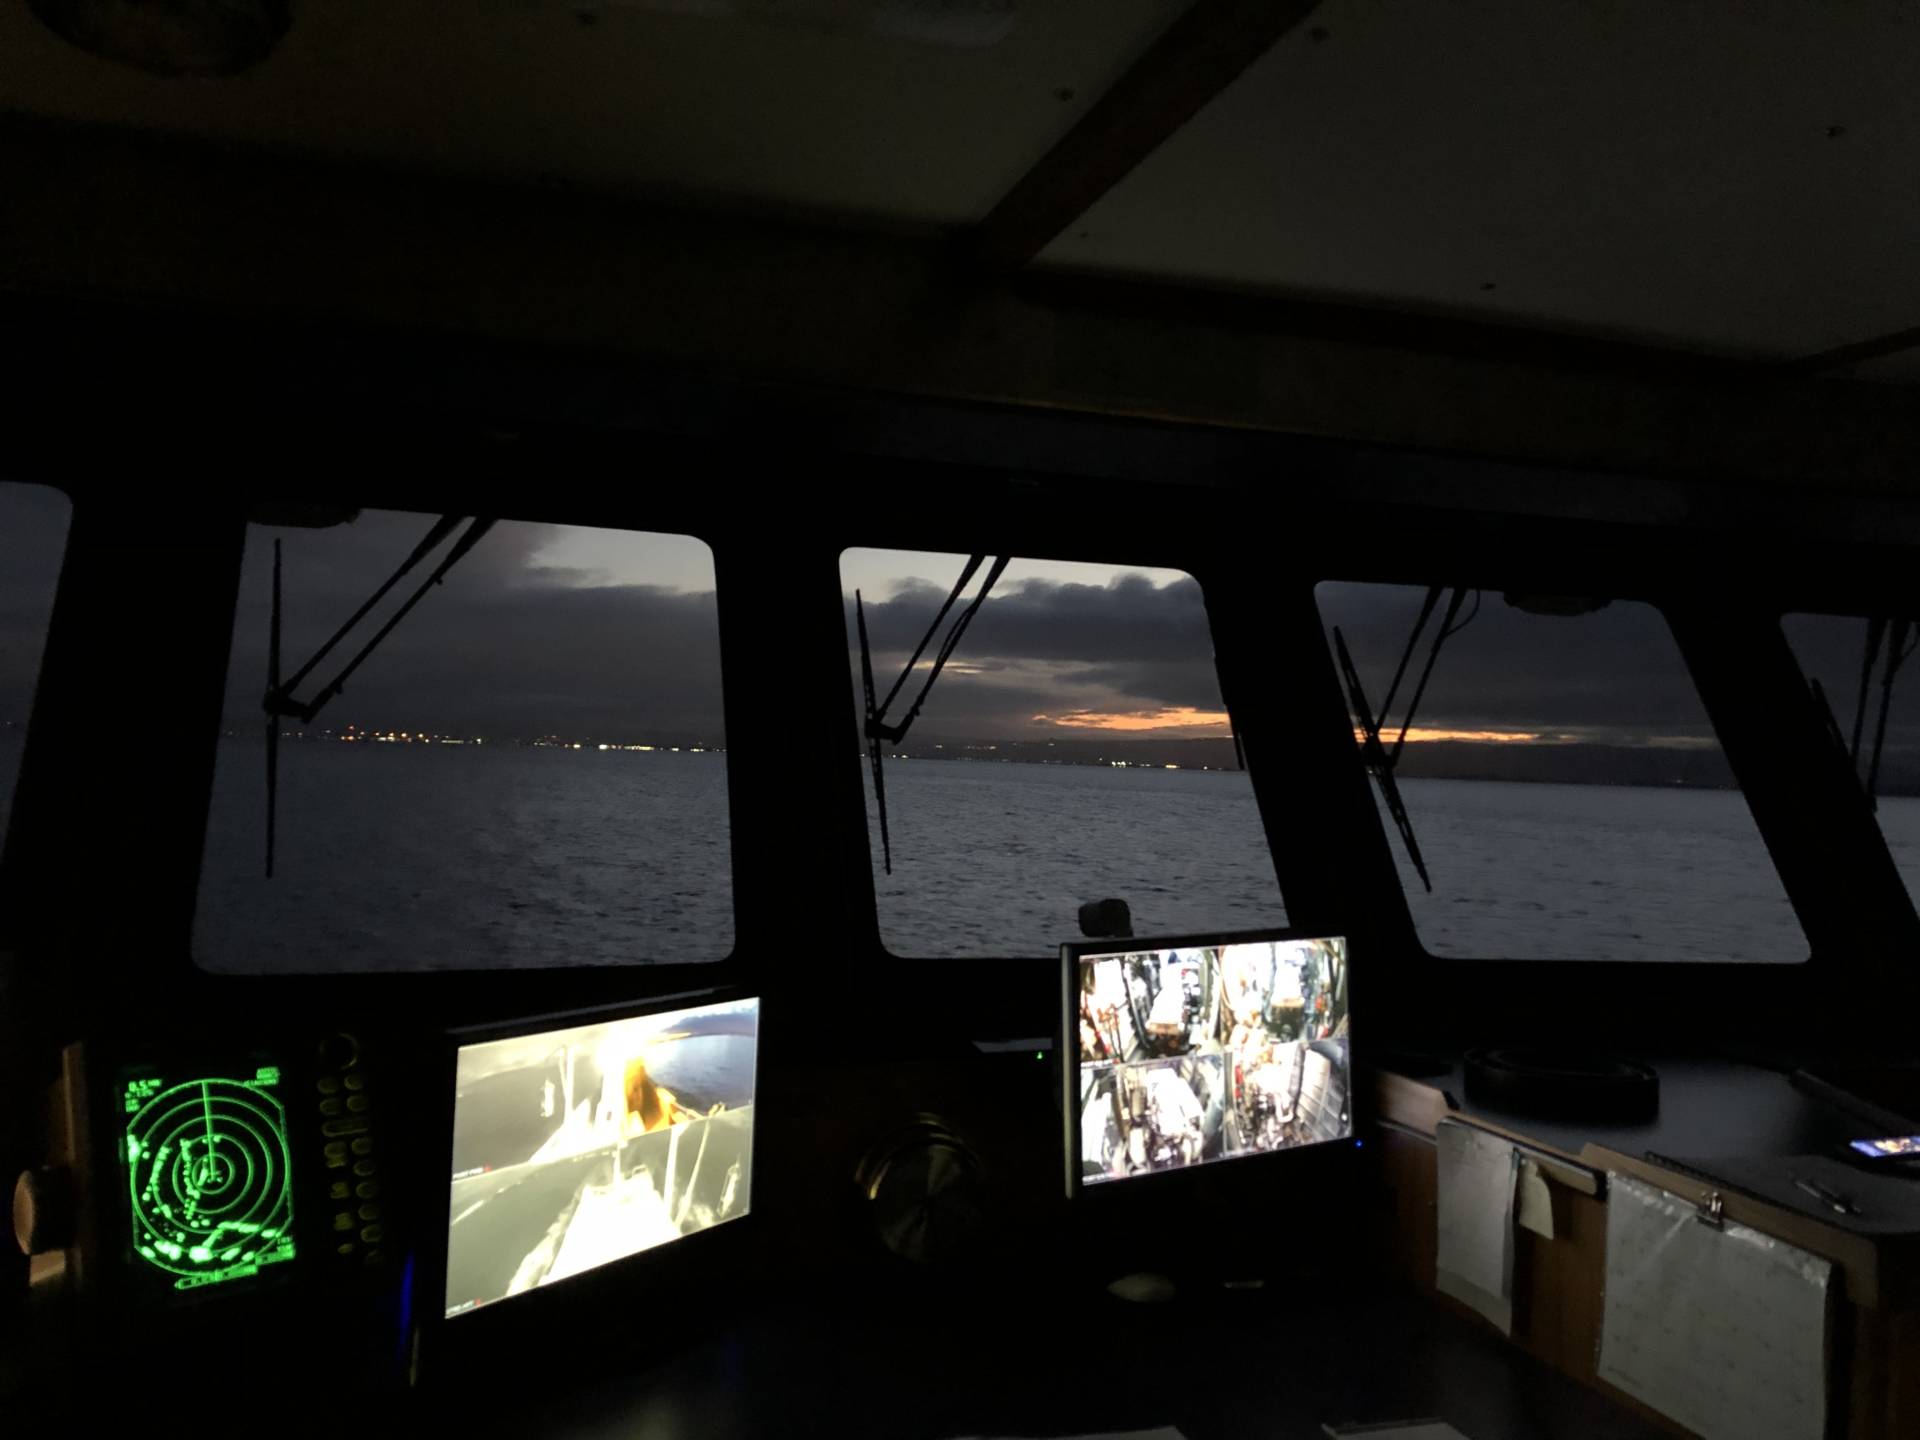
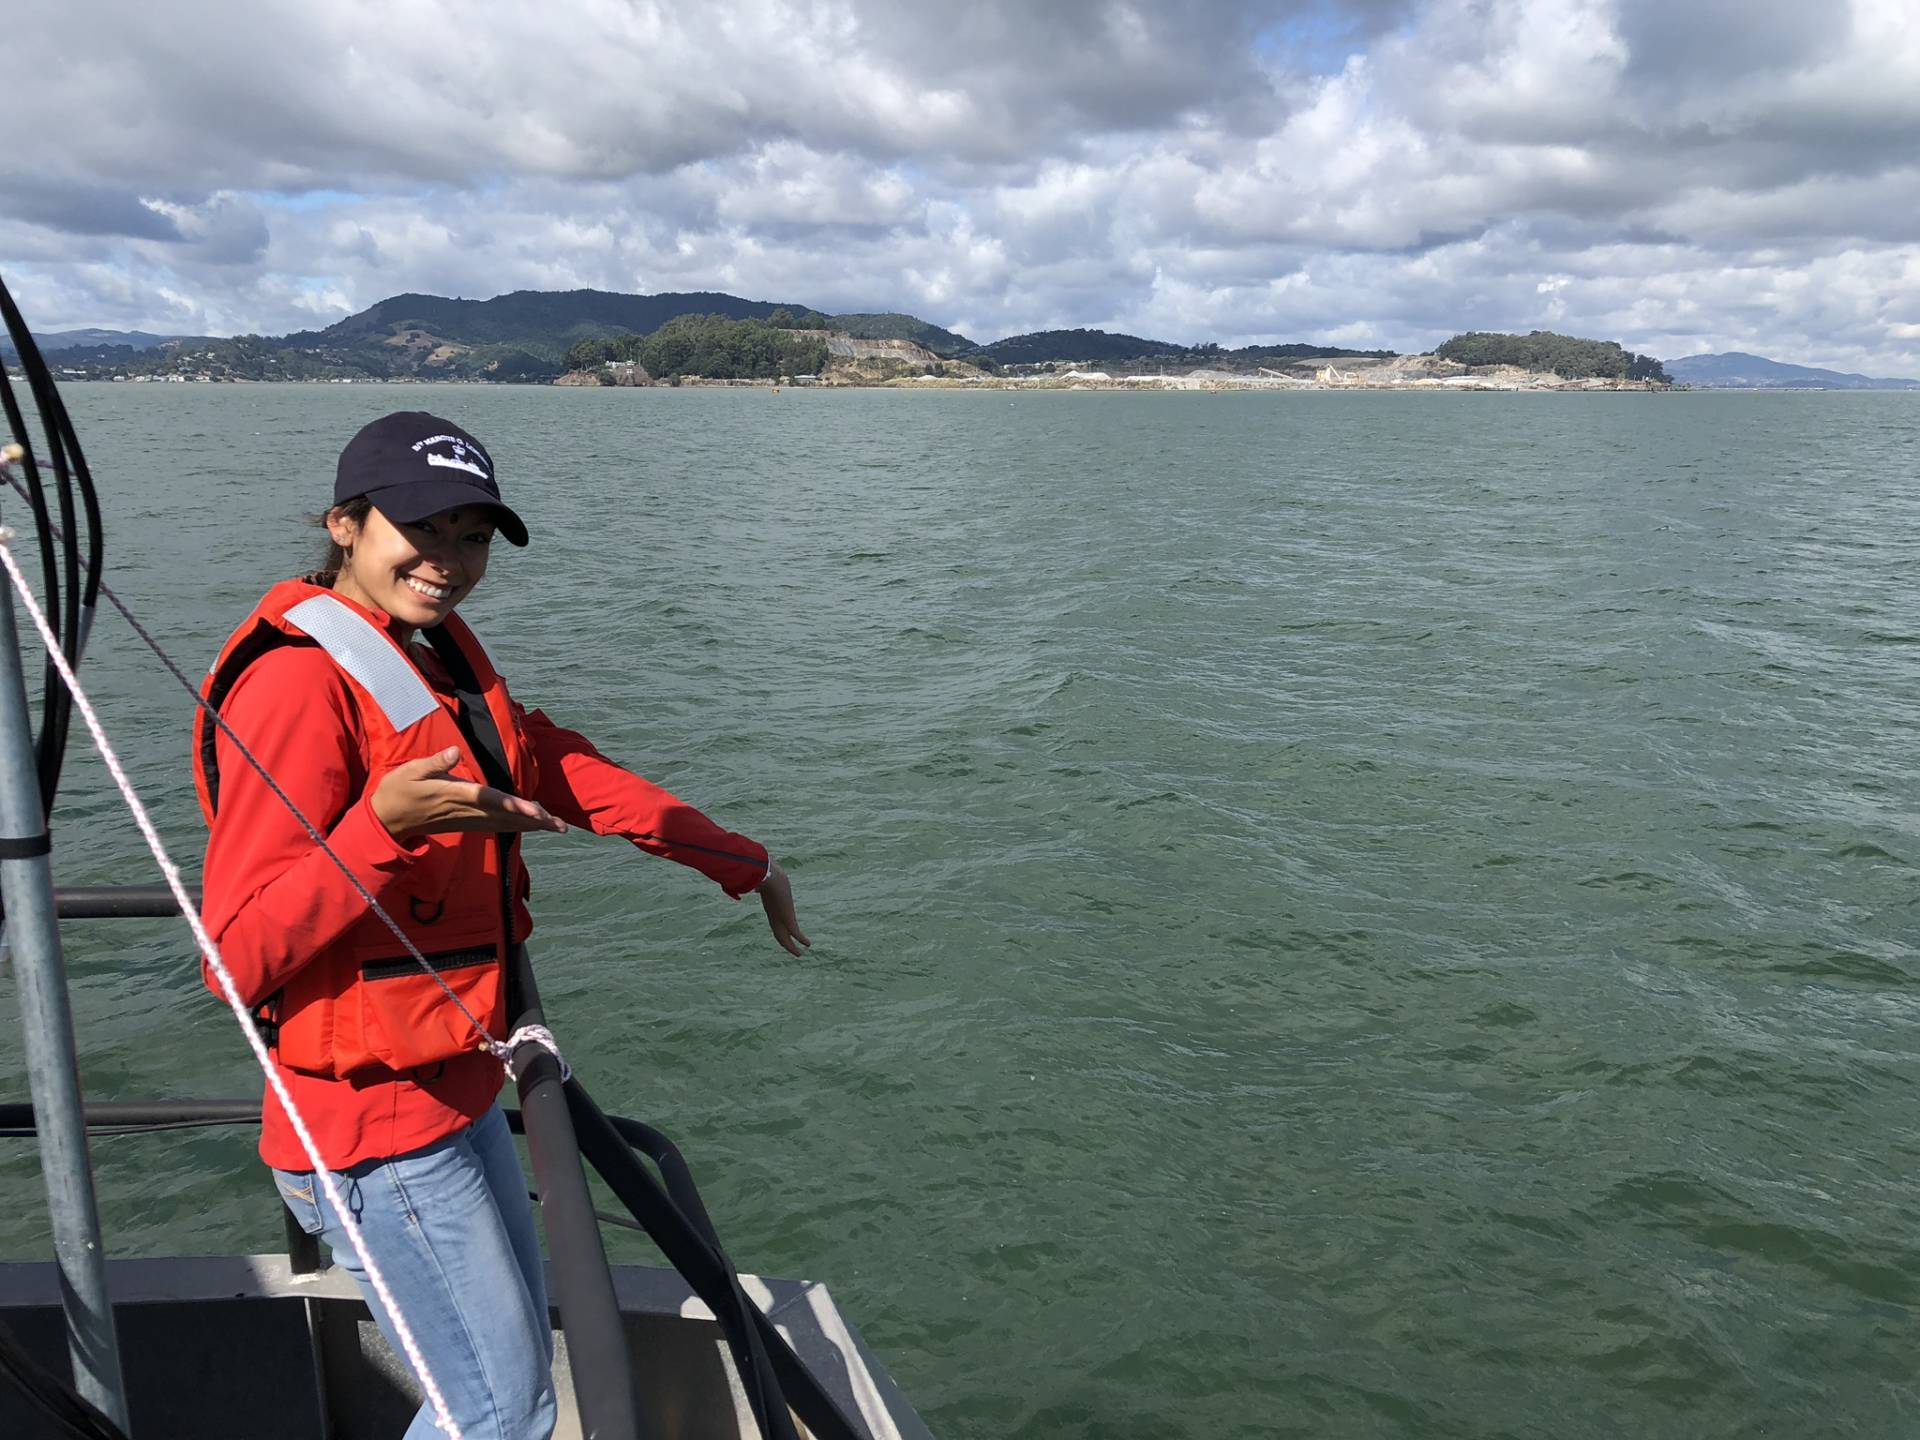
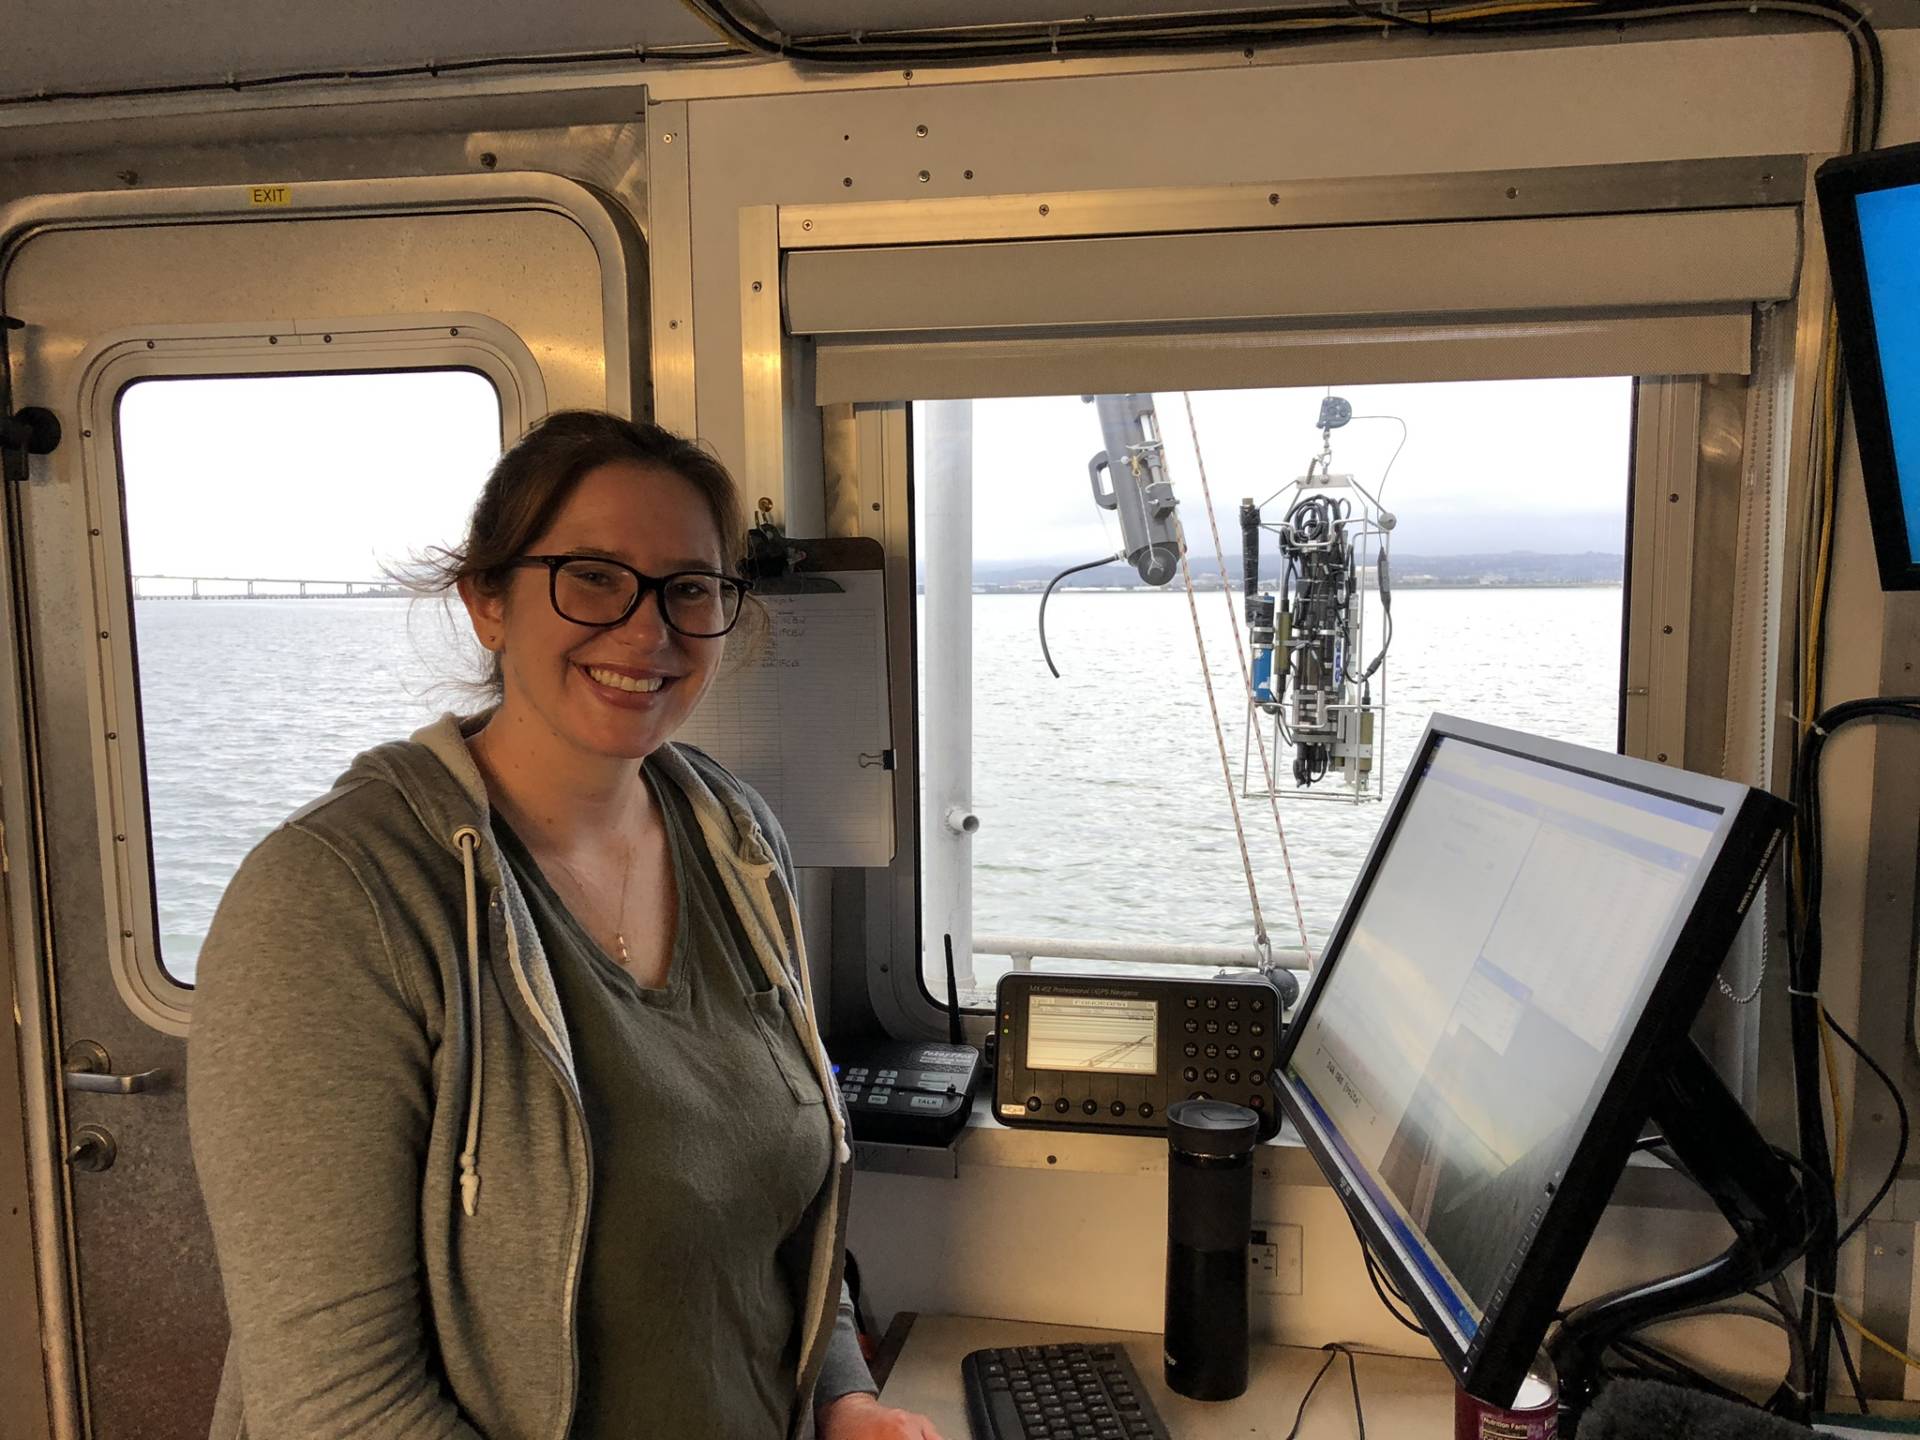
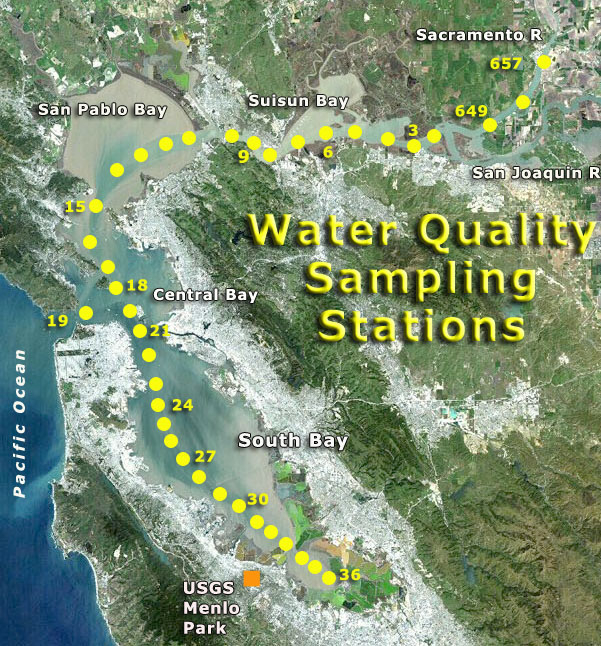
Amanda Font: Here’s where all the data comes in at the USGS. Jim was also part of a project that since 1968, has been collecting water samples in the bay to measure changes over time. These sampling cruises happen about once a month. I talked with Erika Nejat on one of them. She’s a biologist who works for the USGS. This day, she was using specialized instruments to collect the measurements of several different factors, including chlorophyl content.
Erika Nejat: So? So the CTD is taking vertical profiles of the water column at different stations. Every station we stop at is getting a. Complete vertical profile of the app space and time.
Amanda Font: The CTD that stands for conductivity, temperature and depth is a bundle of different sensors attached together. At the end of a cable at each of the sampling locations, Erica lowers this thing slowly to the bottom of the bed.
Erika Nejat: They added this nice camera so I can see what the CTD’s at surface. So I want to start right sitting at surface, and then I go to as close to bottom as I can get without rubbing it into the bottom. So I can see my depth here.
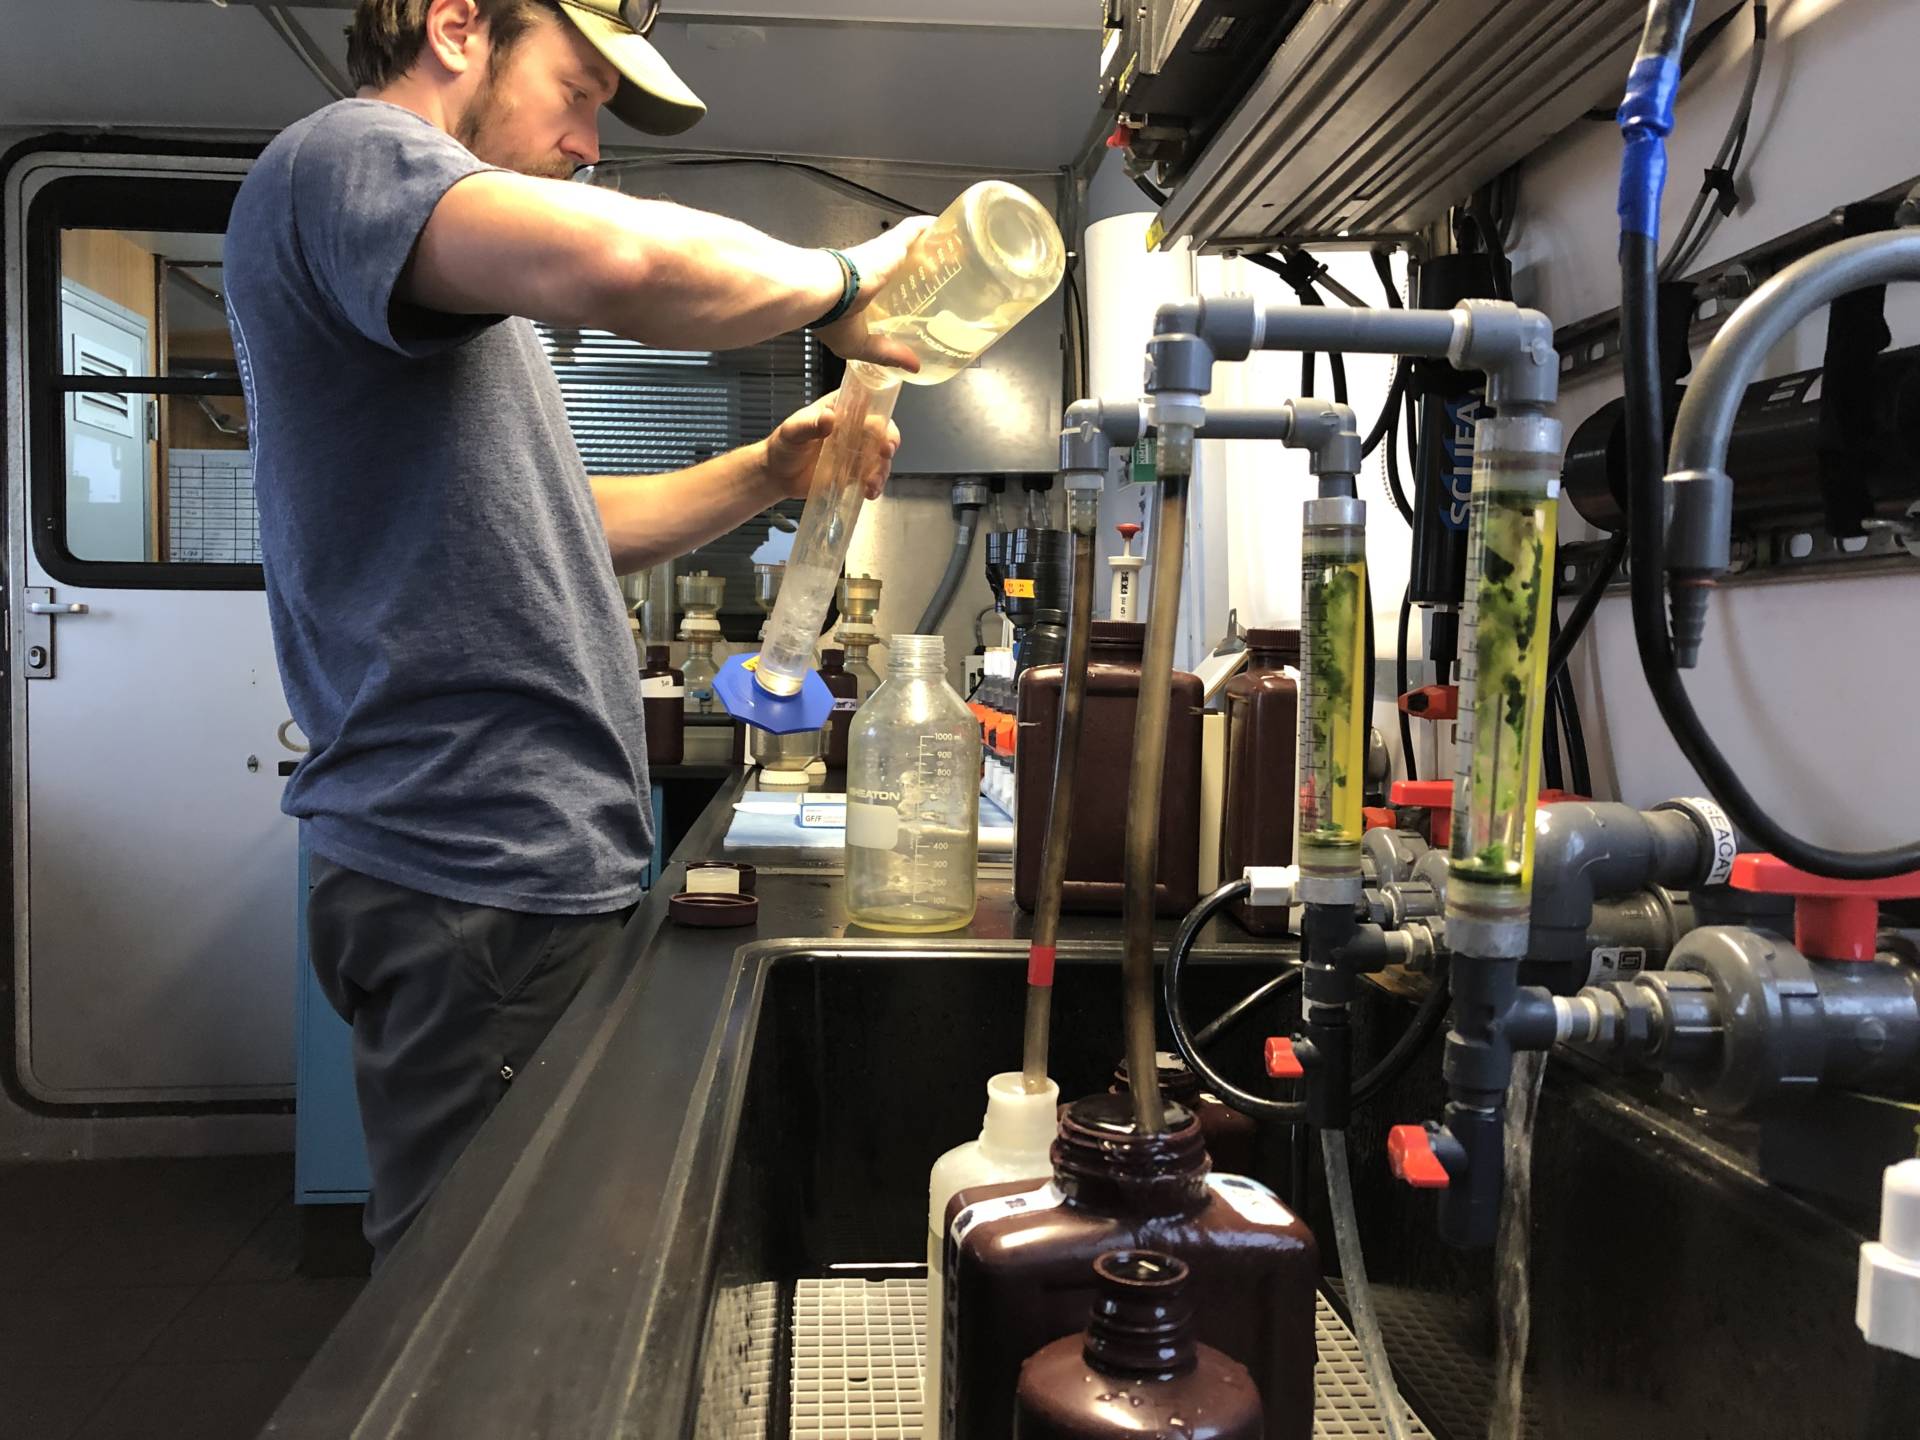
Amanda Font: All the way down. It’s scanning, taking measurements and reporting them back. It comes back up with a sample of deep water so they can study the phytoplankton species later. There’s also a continuous surface water sampler running inside the lab on the boat, and a special instrument that is taking pictures of individual phytoplankton in real time. They’re collecting a ton of information so that when you look at the larger data set, patterns start to emerge. Here’s Jim again.
Jim Cloern: We have measured over the last two decades a trend of increasing phytoplankton. So two things are going on that would make the bay look greener over time. Decreased sediment input, less brown, increasing phytoplankton abundance more green. So yes, there is a trend of increasing greenness in the bay.
Amanda Font: There you have it. It is greener. But we’re not done yet. Because, like Ricardo Montalban in The Wrath of Khan, I want to know why. Why? Why are there more phytoplankton now than before?
Jim Cloern: Now we need to talk about biological communities.
Amanda Font: Phytoplankton are small, but they take up a lot of space. Little on the aggregate, but massive on the whole.
Jim Cloern: If you could weigh all of the communities that live in the bay the phytoplankton, the bacteria, the clams, them, the mussels, the crabs, the fish, the phytoplankton would weigh the most. It’s the living component that has the largest living biomass in the bay.
Amanda Font: They’re right at the base of the food web. A lot of them are eaten by clams and mussels, which are filter feeders. They pull in and blow out water through a tube like structure called a siphon, and in the process, they filter out the nutritious phytoplankton. They used to do this at a pretty astounding rate.
Jim Cloern: And we calculated this is over three decades ago, that if you if you know how many clams and mussels are in the bay, how large they are, you can calculate how fast they’re filtering water. The clams and mussels that live in the bay are pumping a volume of water that’s equal to the volume of water in the bay every one or two days during the summertime.
Amanda Font: If you’ve ever gone swimming in the bay and gotten water in your mouth, just know that it has probably been filtered through a clam. So back before 1998, those clams and mussels were keeping the phytoplankton population under control. But then things started to shift.
Jim Cloern: And in 1999, we started seeing changes in the seasonal pattern of the phytoplankton. We saw bloom in the autumn. We’d never seen anything like that before.
Amanda Font: Our question asker, Justin, was living in New York in 1999, so he didn’t see this shift until it was well underway. The extra phytoplankton blooms were a mystery to Jim and the team, until they checked in with their colleagues who study the clams. They could hardly find any in the bay, but other species numbers were growing.
Jim Cloern: They started seeing record high numbers of crabs in the bay, flatfish in the bay like, you know, Seoul and record high numbers of shrimp.
Amanda Font: Those animals are all coastal marine organisms who live their adult lives in the ocean. But they’re young. Spend the first year or two of life in the shelter of the bay, and they all eat clams.
Olivia Allen-Price: So Amanda, to make sure I have this starting in 1999, we have more clam eaters, fewer clams, thus more photo plankton and greener water.
Amanda Font: Yeah, this is called a trophic cascade. A change in one part of the food web sets off a cascading effect on the other organisms in it, and the clam eater numbers are still up, which is why the water is still that rich shade of artichoke.
Olivia Allen-Price: Why the sudden influx of other animals?
Jim Cloern: We have learned over the last couple of decades that there are natural cycles of the climate system that fluctuate over periods of multiple decades.
Amanda Font: There are these huge wind oscillations that happen way out in the North Pacific Ocean. Around 1999, the direction of the winds shifted in a way that caused the ocean along our coast to churn up cold water from the deep. This is called coastal upwelling.
Jim Cloern: And the cold, deep water is rich in nutrients. So this phase of strong winds, strong upwelling is a period of high biological productivity.
Olivia Allen-Price: All right. So the winds blow. It shifts the ocean climate feeds the flatfish, crabs and shrimp. Their babies drift into the bay, eat the clams. The photo plankton populations grow and the water turns green.
Amanda Font: That’s how it works.
Olivia Allen-Price: And this has something to do with human caused climate change, I assume.
Amanda Font: Actually, no. Jim made it clear that this is not something that has been caused by human actions.
Jim Cloern: These aren’t responses to global climate change. This is part of the natural oscillation of the climate system.
Olivia Allen-Price: Does that mean the water will eventually go back to looking more blue?
Jim Cloern: So this greening period that we’ve experienced since 1998, we might reverse that pattern if we see this next climate shift.
Amanda Font: The only way we’ll really know for sure is if we keep collecting data so we can observe long term changes.
Jim Cloern: It’s really important for us to keep making measurements, keep making observations, because the longer we do this, the more we’re surprised. And surprises are new discoveries.
Olivia Allen-Price: That was reporter Amanda Font. She took the story back to listener Justin Hartung to see what he thought.
Jim Cloern: I’m glad to know that it’s not the climate. I’m glad to know it’s not my failing eyesight or my bad memory. So. Mystery definitely solved. I can also tell my dad that I am not crazy. What she told me was when I told him about this.
Olivia Allen-Price: So thanks for asking the question, Justin. If you’re digging the podcast, you will definitely dig our email newsletter. We send it out the first Wednesday of the month, and it has answers to more listener questions, and we have time to get into on the show. Plus, behind the scenes tidbits like how we used a theremin to make sounds for this episode. Okay.
Amanda Font: Ok, try now. I’m so sweaty.
Olivia Allen-Price: Subscribe at Bay curious.org and you can always find a link in our show notes.
Justin Hartung: Bay Curious is made in San Francisco at member supported KQED.
Christopher Beale: Produced by Christopher Beale.
Katrina Schwartz: Katrina Schwartz.
Olivia Allen-Price: And me Olivia Allen Price.
Paul Lancour: Additional support from Paul Lancour.
Jen Chien: Jen Chien.
Katie Sprenger: Katie Sprenger.
Cesar Saldaña: Cesar Saldaña.
Maha Sanad: Maha Sanad.
Holly Kernan: Holly Kernan.
Olivia Allen-Price: And the whole KQED family. Have a great week.