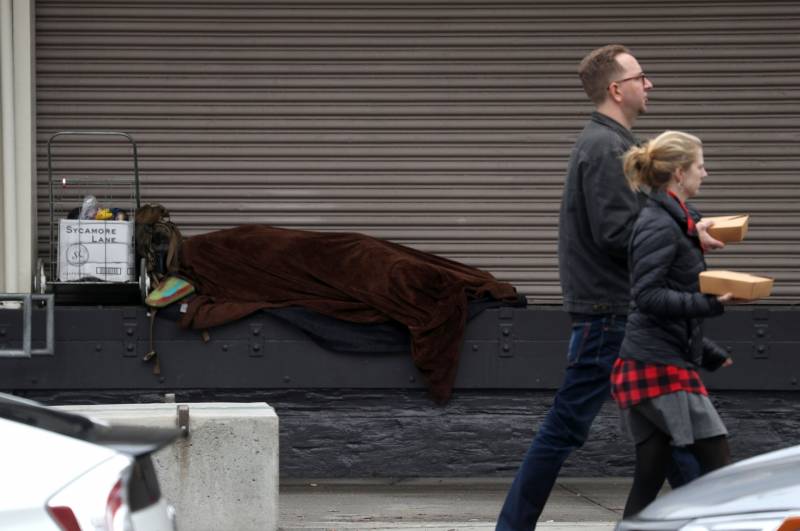
A September analysis of census data from the California Budget and Policy Center found a similar gulf between the state’s rich and poor, but worsening economic outcomes for those at the bottom. Between 2006 and 2018, that report found income for the top 5% of households grew by 18.6%. For households in the bottom 20%, it fell 20%.
PPIC’s analysis did not include figures from individual counties, but 2018 census data shows the widest income disparities in the Bay Area are in San Francisco County, where the top 5% of households makes an average of $808,105 annually, compared with $16,184 for the lowest 20%. San Mateo County had the second-highest income gap in the region, with the richest earning $810,917 per year while the bottom fifth made $25,039.
“Economists think there are incentives to move up the economic ladder, but when the disparities are so large, does that incentive fade away because it’s not possible to make that leap, to invest in the things that move you up?” Bohn asked. “That’s the bigger concern that I have.”
Erica Hellerstein is a journalist with the Mercury News. This article is part of The California Divide, a collaboration among newsrooms examining income inequity and economic survival in California.

