The report uses a new measurement called the “divergence index,” based on U.S. Census Bureau data, to compare the racial makeup of a small geographic area, like a census tract, with that of a larger surrounding region, like a county or metropolitan area. Applying that methodology, the study ranks all major U.S. cities and metropolitan areas by their levels of segregation.
That approach, Menendian argues, yields a much clearer illustration of racial segregation at the local level than more commonly used measurements that typically compare only a few racial groups within a single larger isolated geographic area.
“It’s more accurate because it captures more racial groups and gives you a better sense of the actual level of segregation in a region. And it’s more precise because it’s more granular. It can give you [segregation] scores in a much smaller level of geography,” Menendian said.
Oakland for instance, is among the most racially diverse cities in the country. But zoom in on the map to specific neighborhoods, and a much different picture emerges of racial isolation in many communities, making it the 14th most segregated city in the country based on the study’s metric.
With the accompanying mapping tool, users can view segregation rates throughout the country between 1980 and 2019 by state, metropolitan region, city, all the way down to census tract.
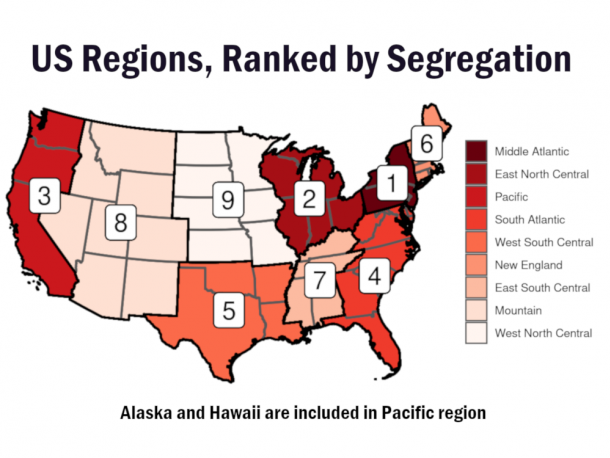
Contrary to common perceptions of the United States, the report finds the most segregated regions in the country are in the Midwest and mid-Atlantic, followed by the West Coast — most typically in Democratic strongholds like Detroit, New York, Los Angeles and Philadelphia. By contrast, segregation rates are more often lower in more conservative, less urban regions like the Plains, the Mountain West and parts of the South.

“This is not a red state or red metro or red city problem exclusively,” said Craig Gurian, a long-time civil rights lawyer and executive director of the Anti-Discrimination Center. “In fact, blue areas of the country in terms of political affiliation come out quite vividly in terms of high segregation. It’s just about everywhere.”
Interestingly, cities with nearby military bases — like Colorado Springs and Killeen, Texas — tend to be the most racially integrated areas in the country.
“These are places where people are brought together in a sustained, deliberate way,” Menendian said. “Because the structures of segregation and racial inequality are so deeply rooted in our society that it takes a sort of deliberate effort.”
The report stops short of directly explaining the underlying causes of residential segregation or proposing specific solutions. It also does not mention certain unintended consequences that have resulted from some integration efforts, such as gentrification and displacement.
But in explaining his findings, Menendian repeatedly alludes to the more than a century of local and federal exclusionary housing policies that have made racial segregation such a deeply entrenched aspect of America’s landscape. In the first half of the 20th century, he said, racial covenants and government-promoted discriminatory bank lending practices, known as redlining, emerged largely in reaction to the rapidly growing Black population in many northern cities during the Great Migration.
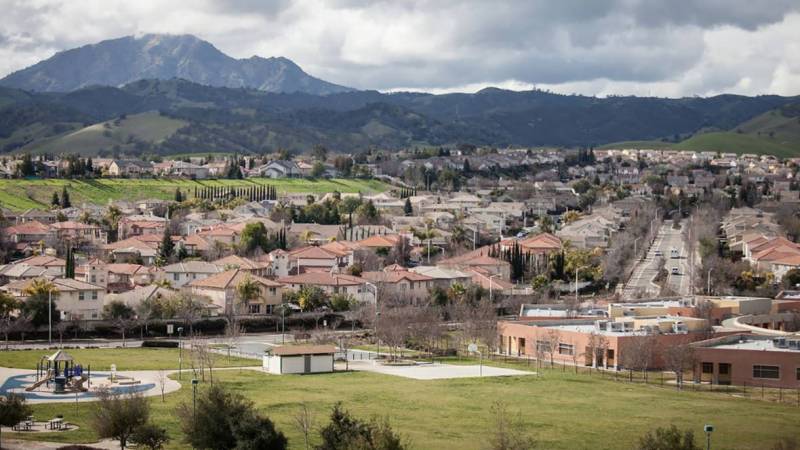
And once those blatant forms of discrimination were ostensibly outlawed by the Fair Housing Act in 1968, scores of state and local governments adopted subtler but equally restrictive policies like land preservation ordinances and exclusionary zoning laws, Menendian said. The measures tamped down development, often barring the construction of affordable housing projects. In the Bay Area alone, he added, more than 80% of residential land is zoned exclusively for single-family homes.


