New York City made headlines this year with the news that its greenhouse gas emissions dropped by nearly 20 percent over the past decade. Other cities and communities nationwide are also developing climate action plans to reduce carbon dioxide (CO2) levels, but how will they measure their success?
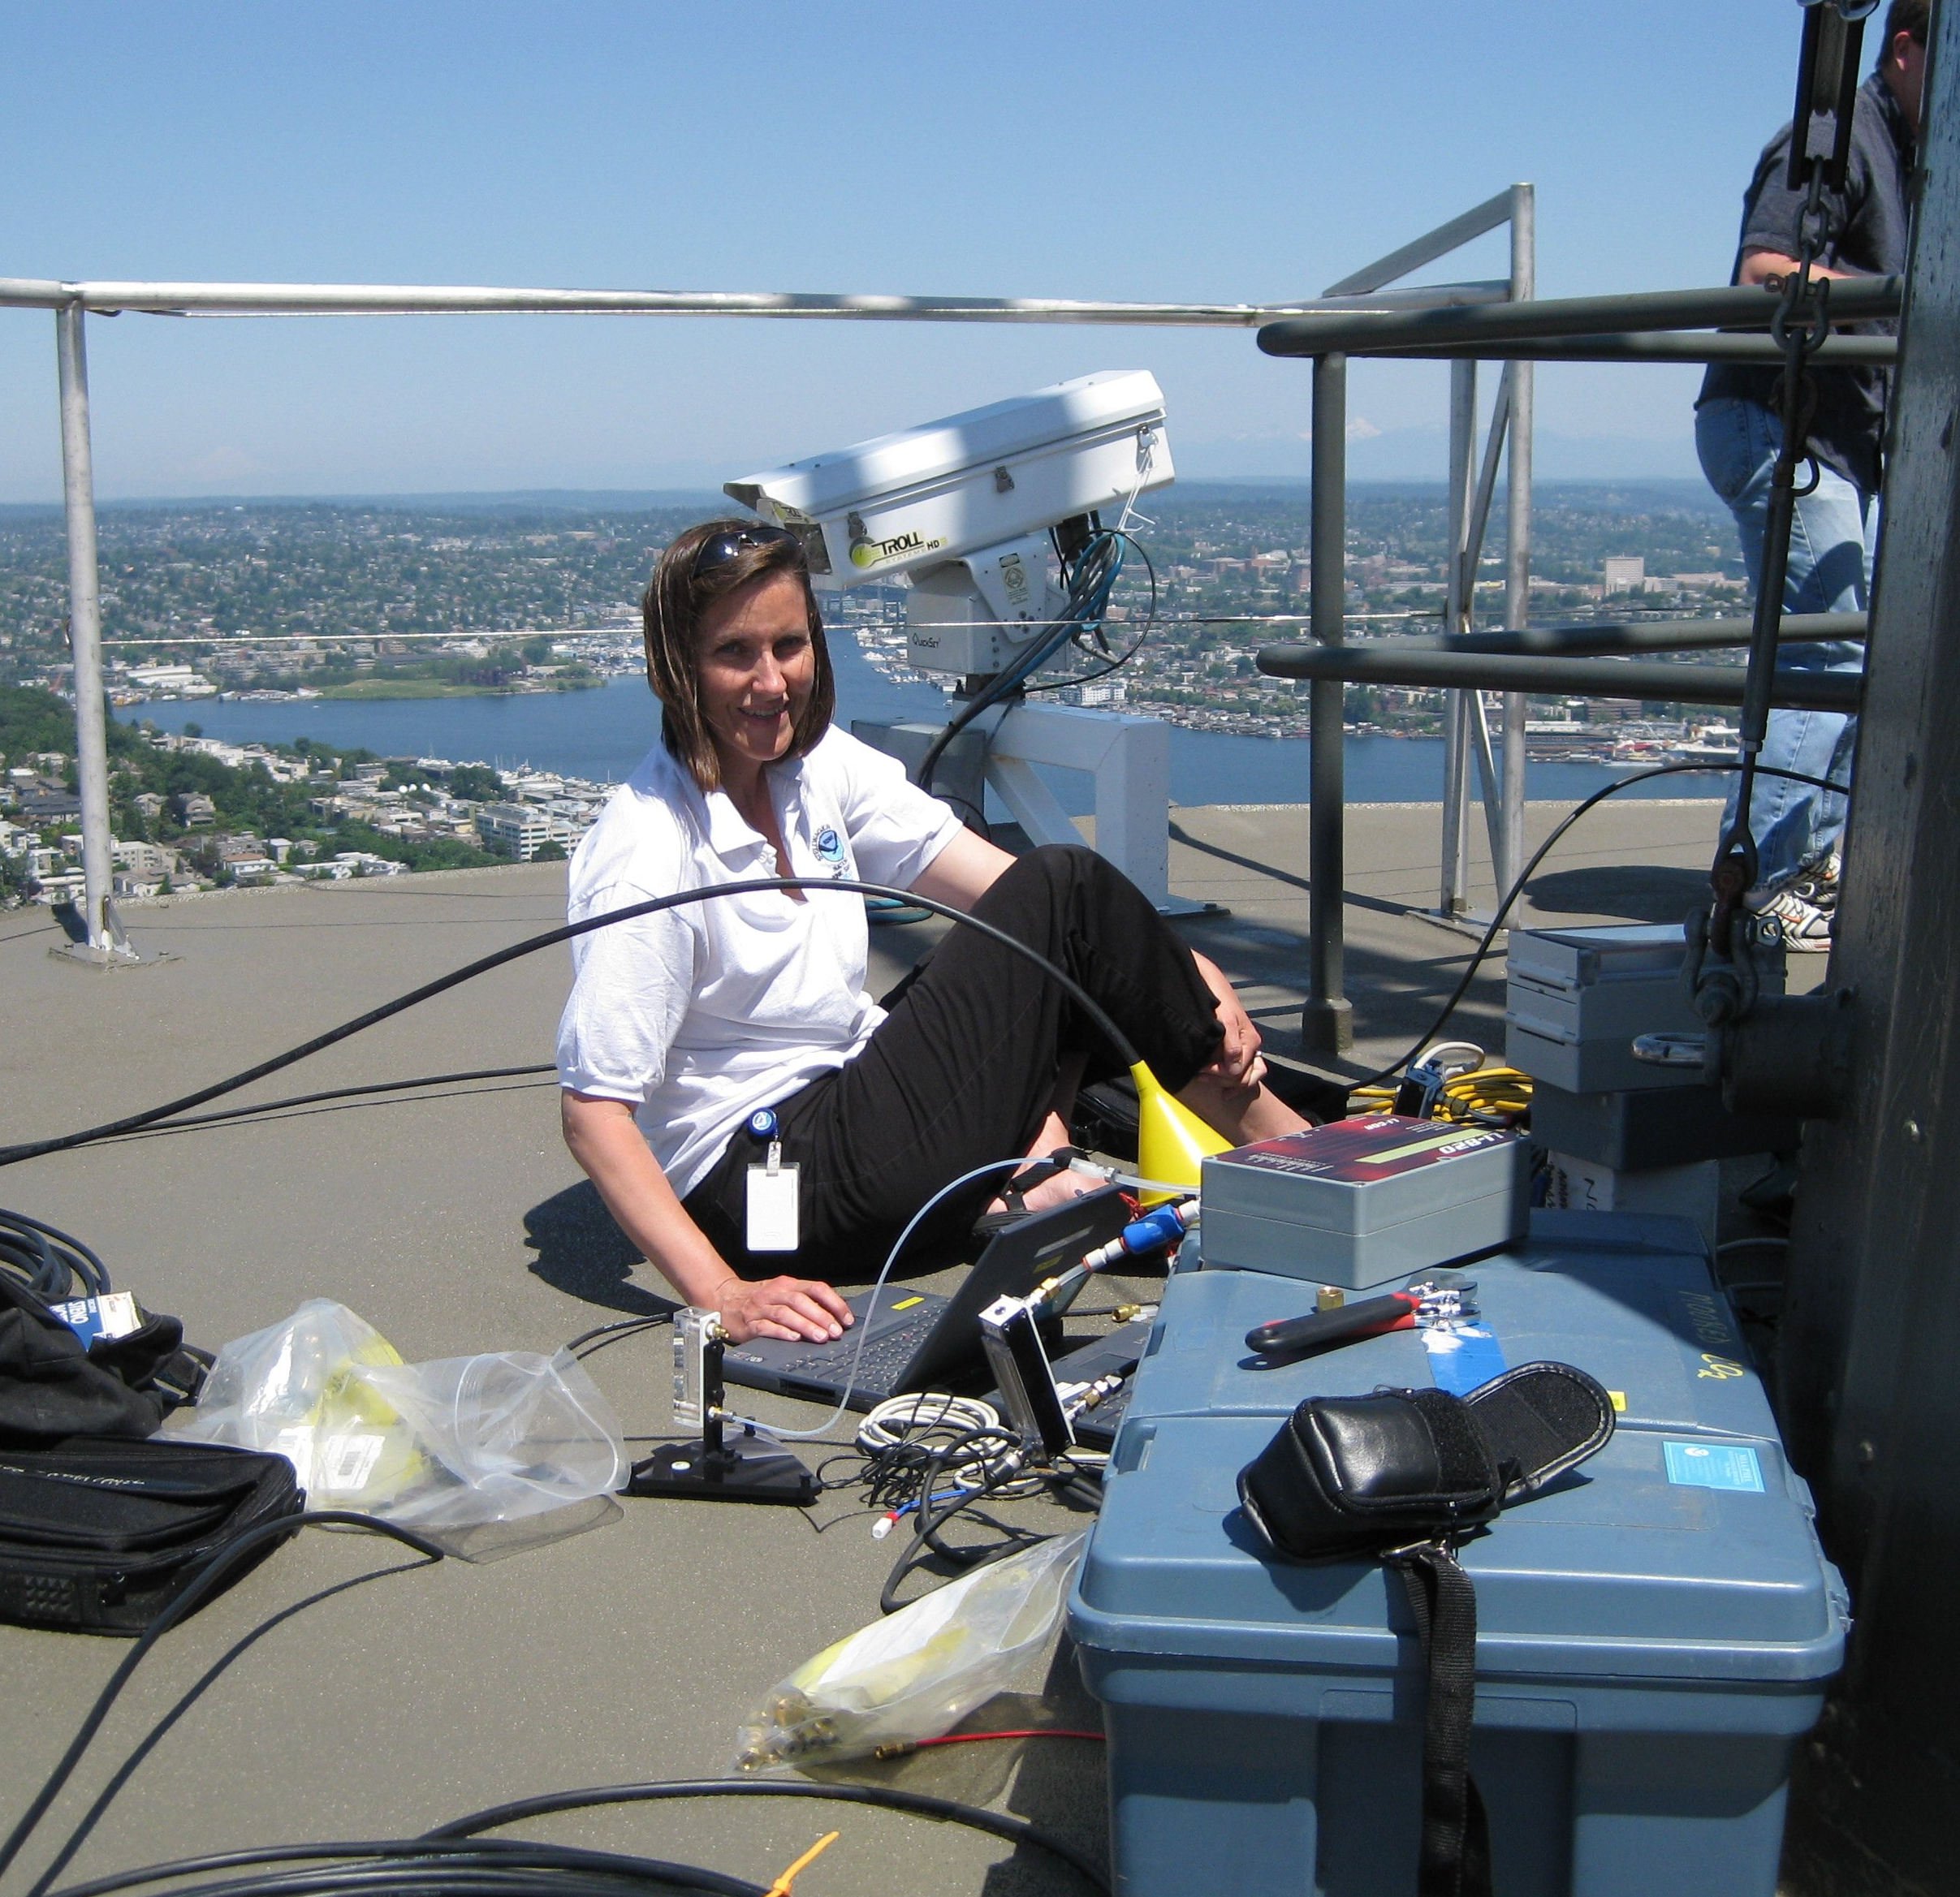
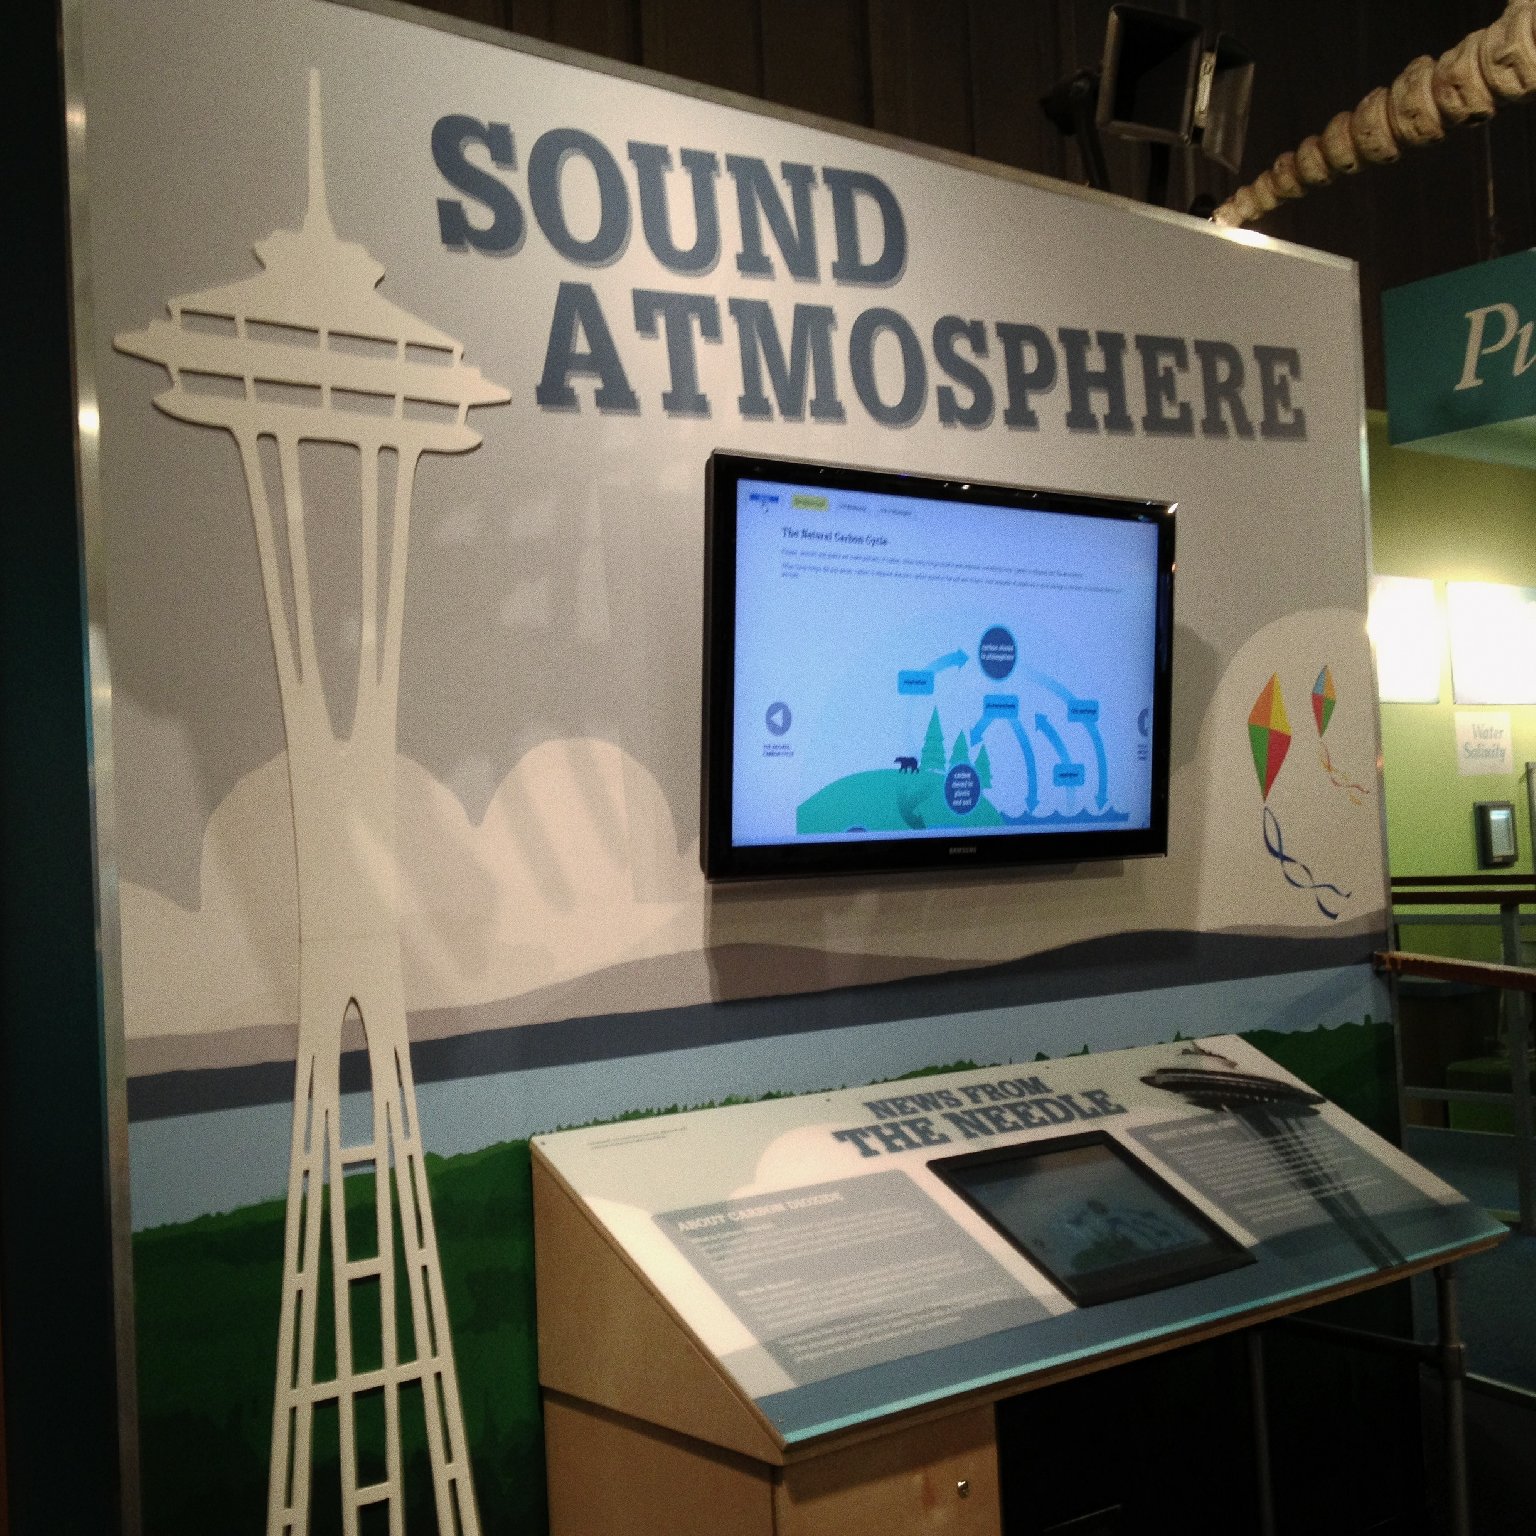
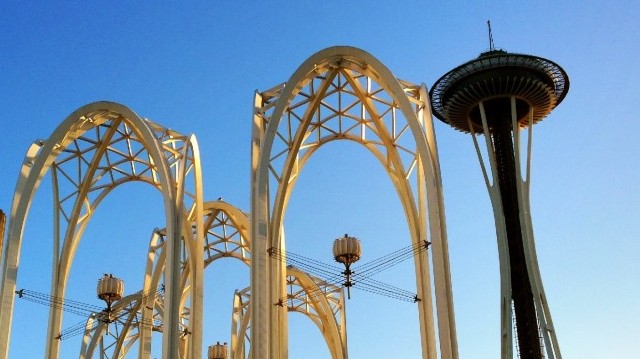
Off the foggy coast of the Pacific Ocean near Aberdeen, Washington, a small monitor sits on a buoy quietly measuring atmospheric CO2. Its sister, a monitor high atop Seattle's iconic Space Needle, does the same. The two monitors create a picture of the carbon emissions generated by our region's population. These monitors allow scientists -- and the public -- to see daily, monthly, and seasonal highs and lows in carbon emissions.
Seven years ago scientists in Seattle installed this innovative system, which lets them analyze real-time data of changing atmospheric CO2 levels and share this information with the public.
In Washington, a state that relies primarily on hydroelectricity to fuel industry, carbon emissions come largely from transportation, industry and residential buildings. This contrasts with most parts of the country, where carbon comes mostly from power plants.
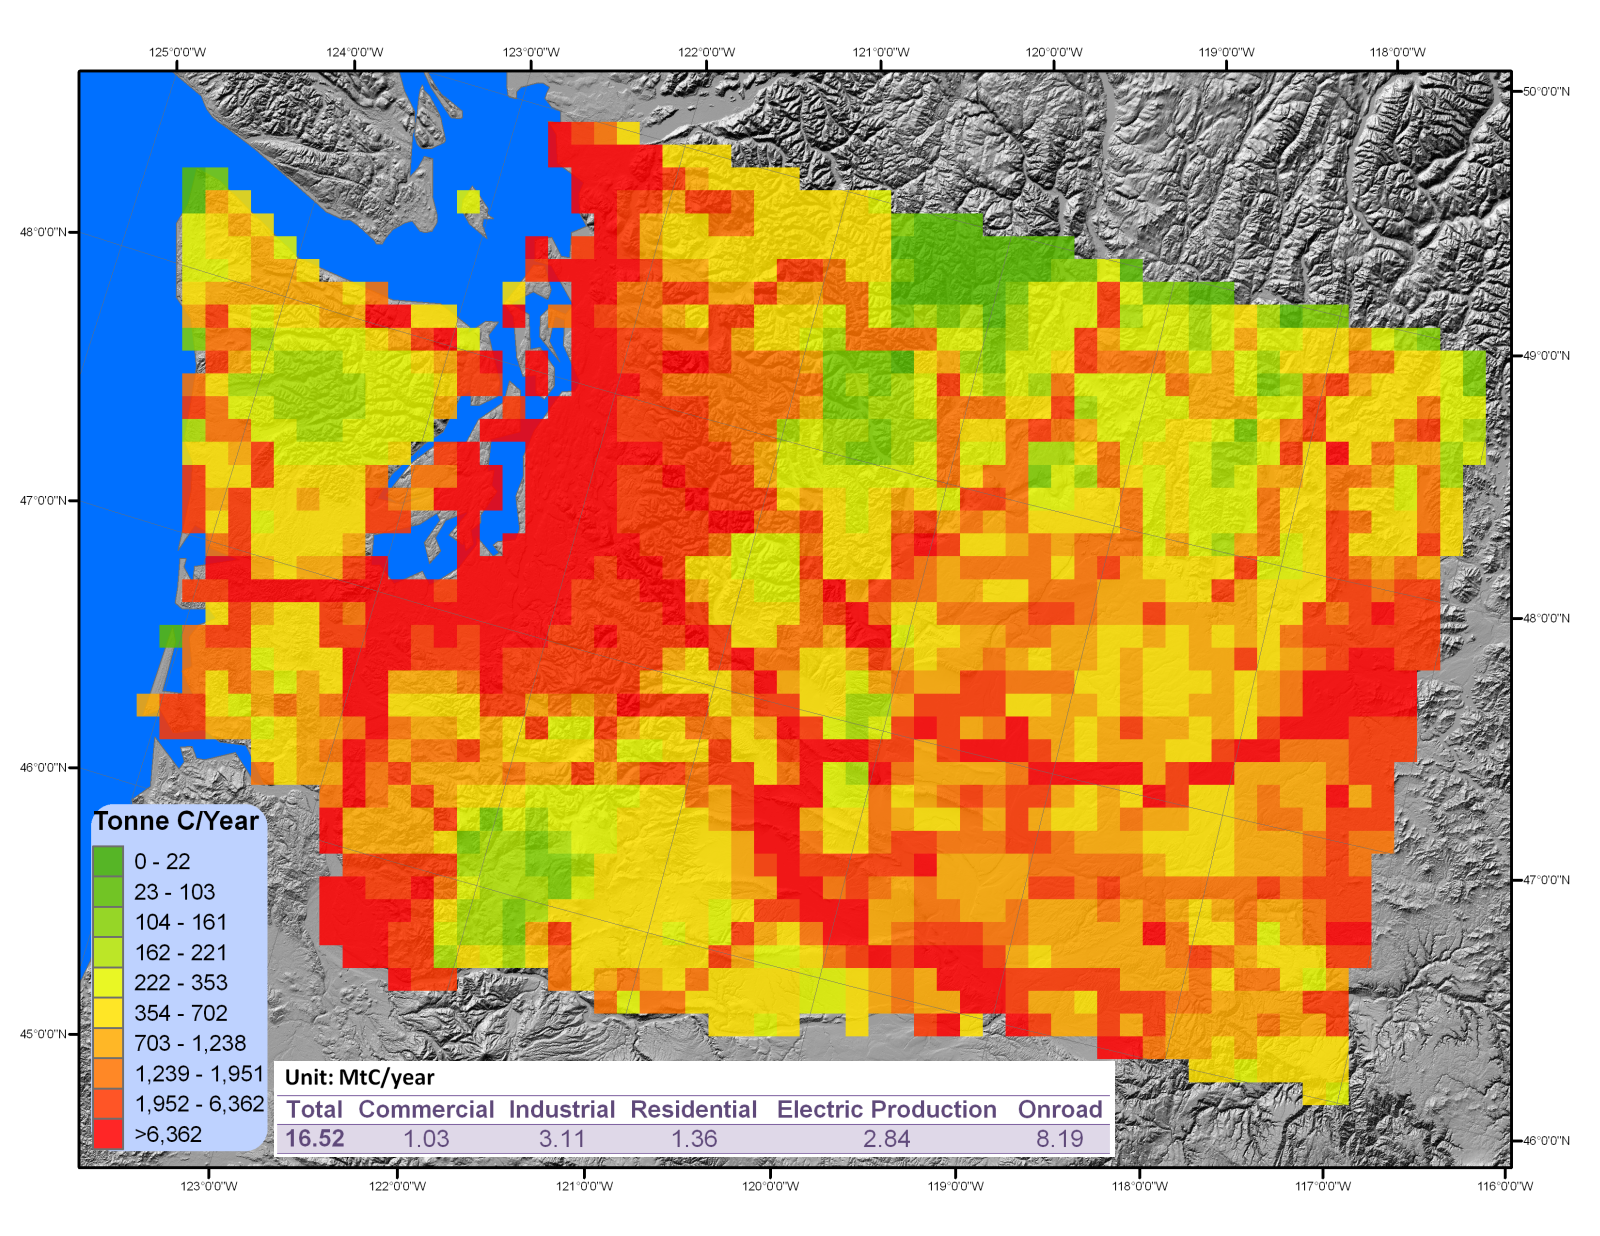
This makes Washington a perfect place for scientists to study the impacts of policy decisions on transportation, industrial and residential emissions, removing the influence of coal-burning power plants.