upper waypoint

Seismology Semantics: Researchers Successfully 'Anticipate' Costa Rican Earthquake

Save ArticleSave Article
Failed to save article

Please try again

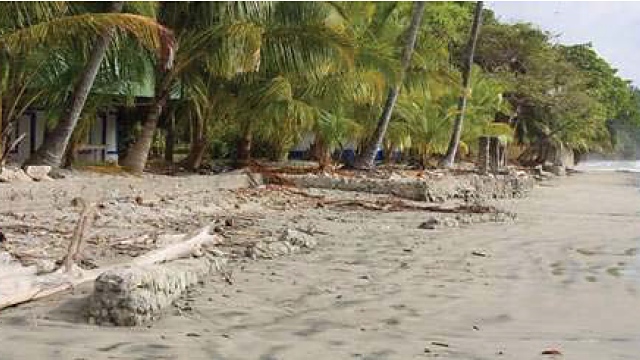
coastal subsidence
Coastal subsidence on the Nicoya Peninsula, shown in this washed-out sea wall, was evidence used in the “anticipation” of a major earthquake that occurred in 2012. Image from Protti et al., “Nicoya earthquake rupture anticipated by geodetic measurement of the locked surface,” Via Nature.

Earthquake prediction is considered a scientifically hopeless task, yet gradually we’ve been learning useful things. In a paper published by Nature Geoscience last month, a team of researchers announced that they had “anticipated” a large earthquake in Costa Rica in fair detail.

In this branch of seismology, a lot rides on the exact language you use. A “prediction” is an announcement that an earthquake of size X will happen on date Y in region Z. Nobody in the profession does that, and the amateurs who do never have results that stand up to scrutiny. The most any seismologist will do is issue a “forecast,” similar to a weather forecast in that it consists of a set of probabilities. For an example, see the Uniform California Earthquake Rupture Forecast, a cautious and exhaustively detailed look ahead at the 30-year odds by a large team of federal, state and academic researchers.

An “anticipation” is something more specific than a forecast, and it succeeded in a special place—the Nicoya Peninsula of Costa Rica. Led by Andrew Newman of the Georgia Institute of Technology, the team took an approach that was counted out 20 years ago and made it work with better methods.

The history of quake prediction is littered with failures, one of which is the “seismic gap” hypothesis. This is a common-sense explanation that can be stated in plain language: large earthquake-producing faults appear to rupture in distinct segments, and for any given segment it should be straightforward to figure out the strain building up in it since the last earthquake that ruptured it thoroughly and say how close we’re getting to its next “big one.” There are some successes from that approach (the 1989 Loma Prieta quake fit the model), but as a global tool it’s repeatedly been found wanting, particularly for the largest events occurring on offshore megathrust faults (the 2004 Sumatra and 2011 Japan quakes, both giant events of magnitude 9, were of this type).

The problem was that until recently, our only tool to see what’s happening on these fault segments was seismicity: the smaller earthquakes going on all the time. But there’s no obvious pattern of seismicity that signals the state of strain on a fault. That would have been too easy. Even a fault that looks like it should be well-behaved doesn’t behave that well. For instance, earthquakes at Parkfield, California, were happening pretty close to clockwork fashion, every 22 years on average, when scientists decided to set up instruments and catch the next 22-year event sometime around 1988. It didn’t happen until 2004—so much for that prediction.
Sponsored

A more promising way to see strain on a megathrust fault is to measure changes in its shape. Imagine a wedge of rubber being pushed, pointed edge first, up a rubber ramp. They’re stuck together by friction, and eventually the friction will be overcome and the wedge will jerk upward on the ramp—that’s the big one. But as the energy between the two block rises during the “interseismic period” between quakes, they will warp. The wedge will bulge on top, for instance. And we can use GPS technology—the same thing our cars navigate with—to measure this change with millimeter precision.

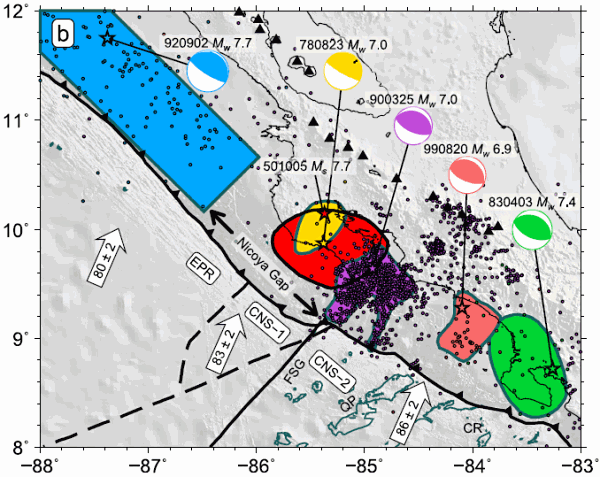
Newman’s team chose Costa Rica’s Nicoya Peninsula because the ground directly above the earthquake rupture zone is on dry land, a rare exception to the usual situation. They noted that the last three “big ones” (magnitude 7.5 or so) there were in 1853, 1900 and 1950 in a nice-looking “earthquake cycle.” And the pattern of large quakes in the region left a nice-looking “Nicoya gap” on the map.

Nicoya seismic gap
Seismic activity of Costa Rica, from Feng et al., “Active deformation near the Nicoya Peninsula, northwestern Costa Rica, between 1996 and 2010: Interseismic megathrust coupling,” JGR 117, B06407 (PDF)

They outfitted the peninsula with a network of GPS stations starting in 1996. They also observed things like coastal subsidence. In 2010 they looked at their data and wrote a paper describing the shape of the “stuck” patch—two stuck patches, actually—on the underlying megathrust fault. “A potential Mw 7.8 1950-type earthquake can be expected from the two fully coupled patches of our best fit interseismic megathrust coupling model,” they wrote. That paper came out in the Journal of Geophysical Research in late 2012—and in the meantime, the earthquake they had anticipated occurred, a magnitude 7.6 event on September 5.

Last month’s Nature paper compared the team’s 2012 anticipation with the actual earthquake and found a decent match.

Predicted quake versus real quake
Anticipated (left) and actual (right) earthquake beneath the Nicoya Peninsula. From Protti et al., “Nicoya earthquake rupture anticipated by geodetic measurement of the locked surface,” ‘Nature’ doi:10.1038/NGE02038

This is pretty darn good. This feat points to the great value of repeating it at other seismic gaps, and megathrust zones in general, by outfitting them with GPS instruments and supporting the long-term collection of data from them. The challenge is using GPS technology on the seafloor. It’s just a fingertip beyond the state of the art, as Newman explained in a Comment in Nature in 2011, and could revolutionize our ability to anticipate—that’s anticipate—tsunamis, too.

lower waypoint
next waypoint