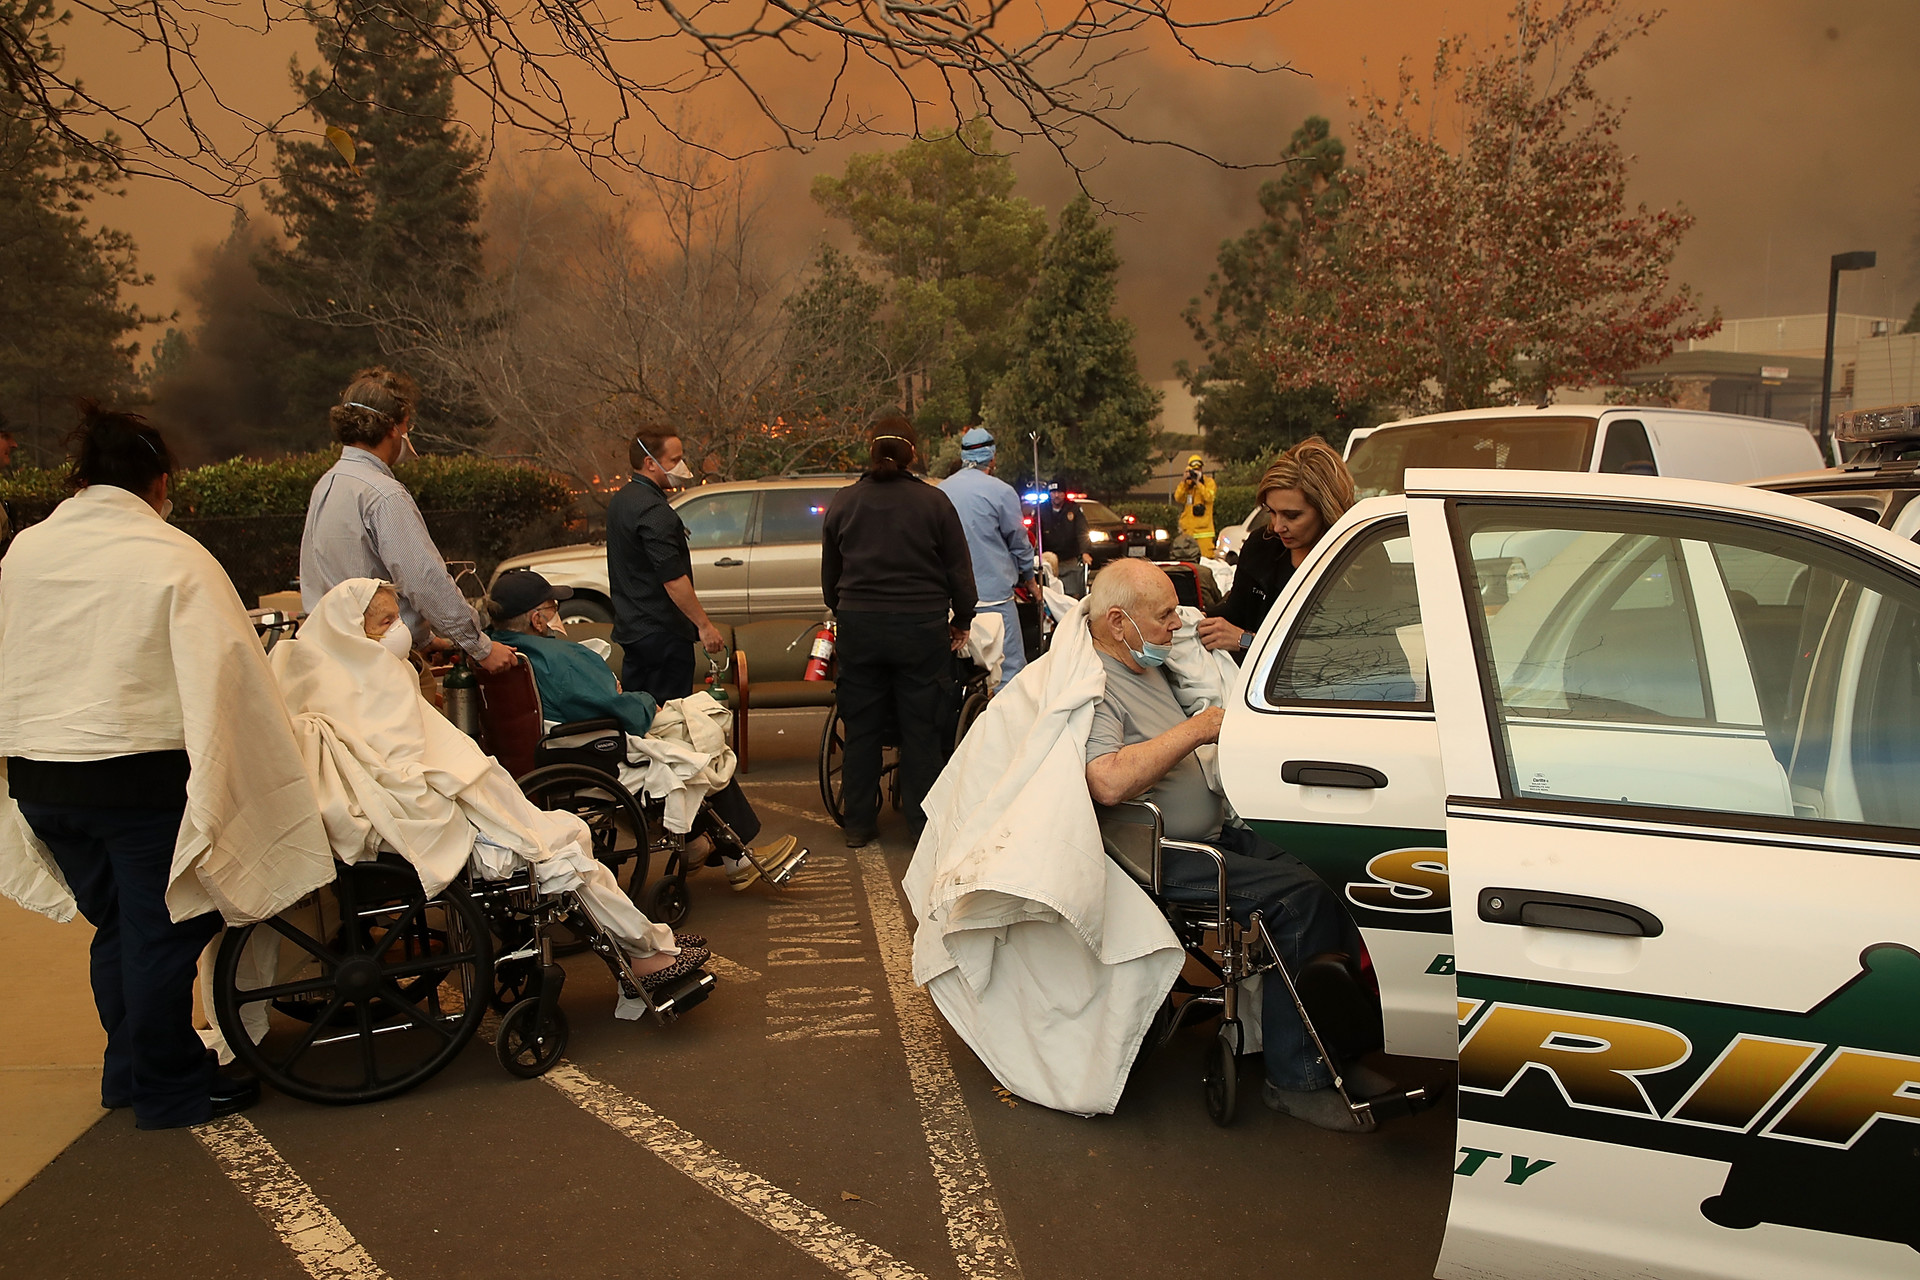
The average age of those who died in the 2018 Camp Fire was 72. The average age of those who died in the fires that burned across Sonoma and Napa a year before: 73.
As wildfires grow more devastating in California, some of the most vulnerable are older people who live independently and who live in long-term care homes.
We wanted to examine the risk fire posed to older people because we know that California projects its population to grow grayer faster than the rest of the country.
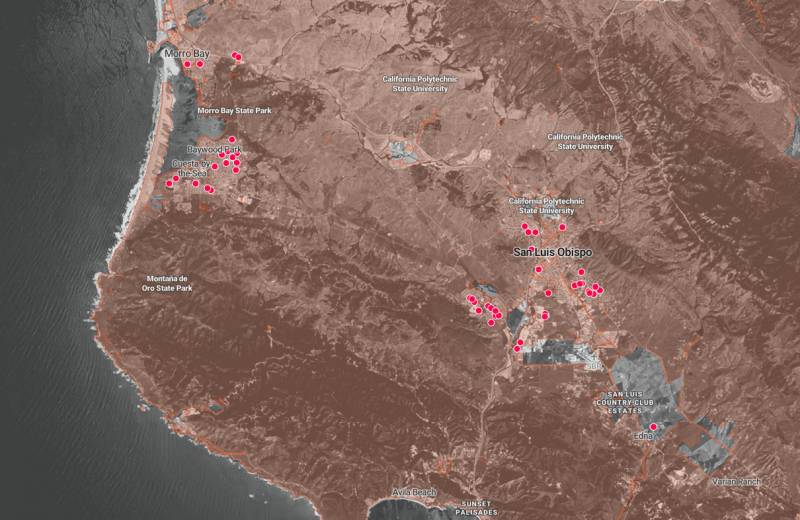
There’s no comprehensive map of fire risk in California. Working with experts we created one for this analysis.
Risk analysis takes into account three qualities: a hazard, exposure to a hazard and a vulnerability to a hazard. To identify these qualities, we chose to analyze the geographic hazard of fire using two sets of shapefiles:
- The Fire Hazard Severity Zones show the physical conditions, like steepness or vegetation, that make it more likely for an area to burn. These are created by the California Department of Forestry and Fire Protection.
- Wildland Urban Interface areas include where development, geography and natural land mix to create fire risks. These areas were created by a team of scientists at the SILVIS lab at the University of Wisconsin.
We used three data sets to map the exposure of older and disabled people to wildfire hazard in certain regulated facilities:
- California Department of Social Services (CDSS) regulated facilities that house older people, specifically residential care facilities.
- California Department of Public Health (CDPH) regulated long-term-care facilities, specifically skilled nursing homes, intermediate care facilities and congregate living health facilities.
- Census tract level data from the 5-year 2018 American Community Survey showing how many people 65 and older live in each area.
To calculate the percentage of “risky” zones in each county, we used the “union” method to split the “risky” zones by county shapes and establish the percentage for each zone using the new shape’s area.

