Background and Overview
With a grant from the National Science Foundation, KQED Science, a unit of the San Francisco-based public media organization, had the opportunity to work with science communication researchers to better understand how to engage audiences with science content. As a part of the grant, KQED Science’s engagement team worked closely with researchers to dive deeper into audience engagement focusing on Deep Look, KQED’s popular YouTube science video series about small animals and the natural world. The series gives viewers an up-close perspective of creatures like spiders, hairworms, mites and ladybugs with its 3-4 minute videos shot in ultra-high definition.
KQED’s science engagement team is on the front lines of making sure our overall science content, which includes science news and our Deep Look videos, are shared and engaged with on our various social media platforms. One of the platforms we use daily to disseminate our science content is Facebook. To better understand the success of our efforts beyond the usual metrics we track, the science engagement team tested a few Deep Look grant-related research questions using Facebook as a parallel research tool to our grant’s more traditional survey related research.
More specifically, Facebook’s advertising platform provides us with the tools we need to conduct more in-depth audience research. Similar to other digital advertising tools such as Google, Twitter, YouTube, and others, Facebook allows users to reach an intended audience based on interest, age, gender and location. We launched a few Facebook advertising experiments comparing the success of engaging general audiences versus science-inclined audiences, which is a new process for us. Due to our limited advertising budget we generally optimize our advertising for science-inclined audiences for the most success. For these tests we were interested in finding new science-inclined audiences and audiences we were missing.
In this post, we’ll review some of the highlights of our Facebook experiments and findings relating to audience engagement with different types of Deep Look titles and images.
Our digital video audience research specifically looked at the problem of gender disparity for our Deep Look series. Deep Look viewers are majority men with women representing only 30% of the audience. Our research is an effort to address this disparity. To summarize the findings from the research, here’s the gist of Deep Look’s questions that we were exploring in our Facebook experiments:
- Disgust sensitivity: Is disgust sensitivity a factor in why women decide not to click on our Deep Look content? Are “disgusting” titles less appealing to women?
- Stereotype threat: Will including an image of a woman in the thumbnails of our Deep Look episodes encourage more women to click on the video link to watch the video?
- Titles: How does including titles that have more of a health and sex/mating theme affect women’s engagement? (FYI — why are we asking this question? Read the full findings here.)
Our Facebook experiments are complementary to the following Deep Look research conducted under our NSF grant, Cracking the Code, and summarized in the following blog posts:
- Do Stories about Health – and Sex – Draw Women to Watch KQED’s Deep Look Science Videos? .
- What’s Keeping Women from Watching Deep Look’s Science Videos? No Easy Answers
- Survey Takes A 'Deep Look' at Science Video Audience and Gender Disparity
To learn more about our methods and learnings, read on!
Audiences
The design for all of our research is based on a “science curiosity scale,” a survey developed by Dan Kahan (Yale University), Asheley Landrum (Texas Tech University), and their collaborators, that predicts interest in science and identifies existing and missing audiences that are science inclined, but perhaps not engaging with KQED science media. To learn more about the science curiosity scale, click here.
To find our “science curious” audience on Facebook and to have a baseline of a “general interest” audience, we specified four different target groups on the platform, all in the U.S.:
- Men aged 18+ unselected interest (general interest)
- Women aged 18+ unselected interest (general interest)
- Men aged 18+ interested in Science and Nature (Science curious)
- Women aged 18+ interested in Science and Nature (Science curious)
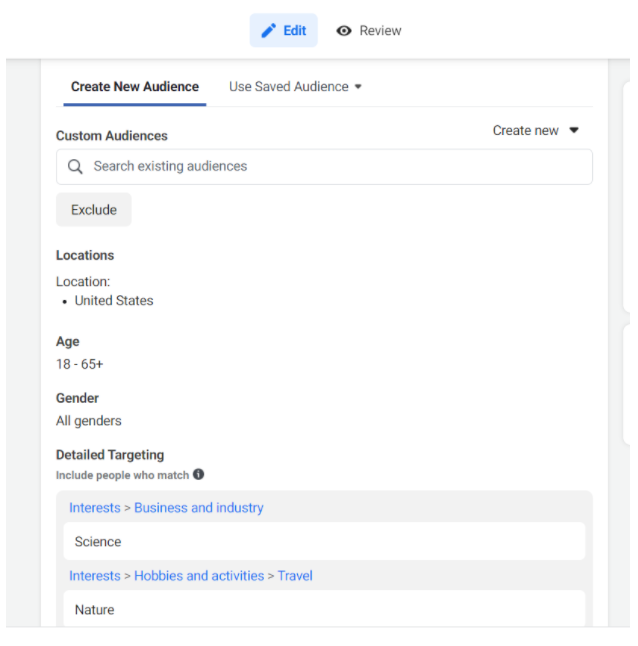
In order to focus on the women and men interested in Science and Nature, we selected “Science” and “Nature” in the detailed targeting section of the Facebook advertising platform as seen in the figure below.
We wanted to see the difference in engagement on the different Deep Look Facebook posts among men and women in general, and among men and women who had Science and Nature listed in their interests on their Facebook profile. See figure below for a screenshot sample of the ad targeting on Facebook:
Creating the Ad Campaigns
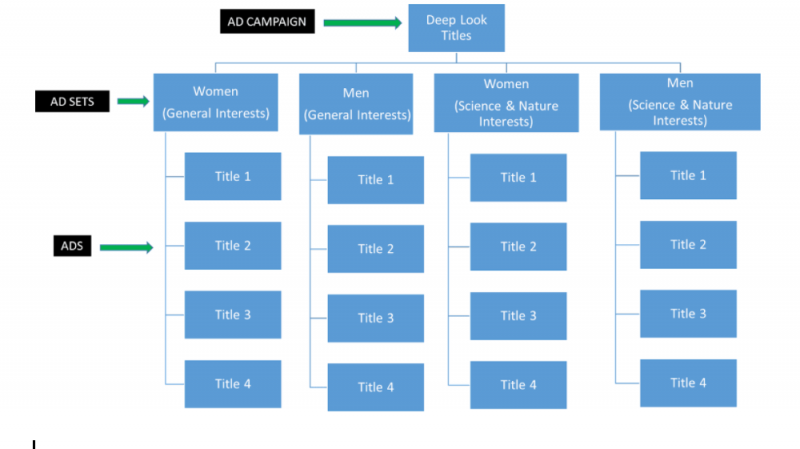
An ad campaign is a group of ad sets and ads that share the same metric objectives such as Traffic, Engagement, Lead Generation, Video Views, and more. In creating an ad set, you are required to define your reach, budget, schedule, and most importantly, target audience. Once the ad sets have been created and the target audience and reach has been identified, the actual ads need to be created. The links, photos, descriptions, titles, and other aspects of the creatives are finalized in the ads section. For example, when we designed the Deep Look titles test on Facebook, we structured it as below:
Measuring Metrics
The two metrics we focused on were the number of landing page views and the total reach of each ad. Landing page views refer to the number of times a person clicked on one of the ads and successfully loaded the destination webpage (here, our Deep Look page on KQED.org). Reach refers to the number of people who saw an ad at least once. For a full list of metric definitions provided by the Facebook advertising platform, please go here.
We analyzed the ratio of these two metrics: the Result Rate and the Difference in Result Rate. Result Rate is the percent of people reached who successfully opened the landing page. The Result Rate, thus, serves as a measure of the success of the ad campaign and is calculated using the following formula:
Result Rate (%) = Landing Page Views / Reach*100
To evaluate the relative success of the ad campaigns, we compared the result rates across all four target audiences by calculating the difference in result rates. The formula is as below:
Difference in Result Rate (%) = Result Rate (Constant) - Result Rate (Variable)
In addition to measuring the landing page views and reach, we also conducted a thematic analysis on the comments on the different ads and noted that in our findings.
Experiment Conditions: The Different Ad Sets & Learnings
Disgust Sensitivity: Ad Sets
Research Question: Is disgust sensitivity a factor why women decide not to click on our Deep Look content? Are “disgusting” titles less appealing to women? The hypothesis is that women are less likely to choose to watch a video based on the title when the title suggests the content may be "disgusting."
In this Facebook test, the Deep Look “Turret Spiders” episode, used in an earlier research study, was used to test this disgust sensitivity hypothesis. To conduct the earlier study altered titles were created — ones that were more disgusting and ones that were less disgusting than the original title —- to compare which titles were preferred by women. For the FB study, we used the A/B testing function on the Facebook advertising tool using these altered titles with the goal to drive page views to the Turret Spider episode.
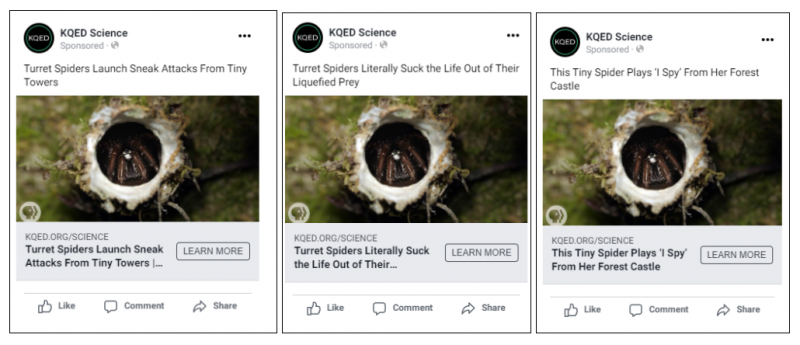
The original and altered titles were as follows:
- Original Title: Turret Spiders Launch Sneak Attacks From Tiny Towers
- Least Disgusting: This Tiny Spider Plays 'I Spy' From Her Forest Castle
- Most Disgusting: Turret Spiders Literally Suck the Life Out of Their Liquefied Prey
For this Facebook study, we hypothesized that fewer women would click through to the episode with the most disgusting title compared to men. That is, the results rate for women would be lower than the results rate for men. Furthermore, we predicted that more women would click through to the site who saw the least disgusting title than those who saw the most disgusting title.
Disgust Sensitivity: Findings & Learnings
Across all target audiences, people were most engaged with the Original Title (Turret Spiders Launch Sneak Attacks From Tiny Towers).
Ranking of titles clicked by women from most clicked to least clicked:
- Original Title: Turret Spiders Launch Sneak Attacks From Tiny Towers
- Least Disgusting: This Tiny Spider Plays 'I Spy' From Her Forest Castle
- Most Disgusting: Turret Spiders Literally Suck the Life Out of Their Liquefied Prey
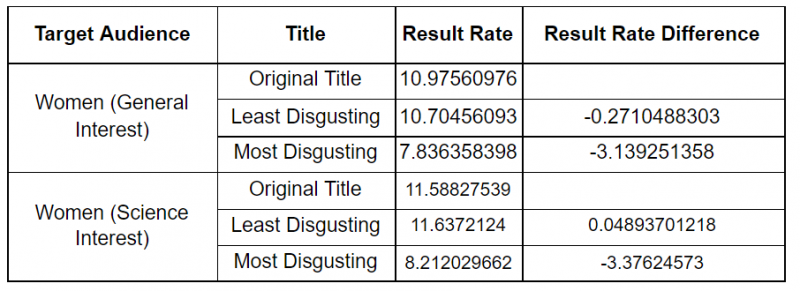
The Result Rate Difference is calculated by the following formula:
Result Rate Difference = Original Title Result Rate - Least Disgusting Result Rate
OR
Result Rate Difference = Original Title Result Rate - Most Disgusting Result Rate
See below for table of the Result Rates among our women audiences:
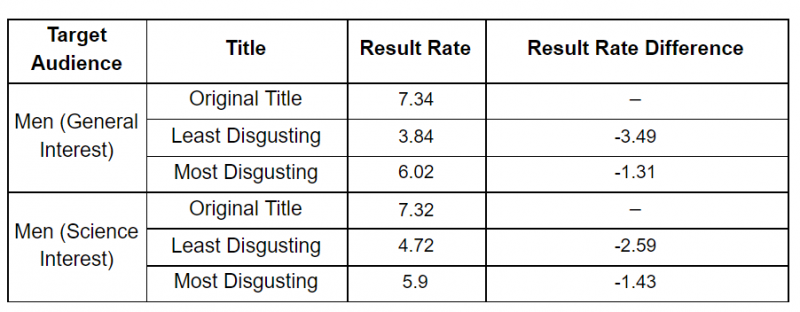
Ranking of titles clicked by men, from most clicked to least clicked:
- Original Title: Turret Spiders Launch Sneak Attacks From Tiny Towers
- Most Disgusting: Turret Spiders Literally Suck the Life Out of Their Liquefied Prey
- Least Disgusting: This Tiny Spider Plays 'I Spy' From Her Forest Castle
See below for a table of Result Rates for our Men audiences:
Comment analysis for women:
- Women showed more approval for the “Least Disgusting Title” episode, and had less disgust reaction based on their comments.
- The “Most Disgusting” title elicited more disgust among women as evidenced by their comments (“Creepy!” “Gross!” “Ew ...”)
- The “Original Title” also generated some disgust reaction, but less than the most disgusting titles (“Yuck, creepy” “Ok that's creepy” “Ugly little critters! Yuck!”
- There was some humor in the comments:
- Turret Spiders Literally Suck the Life Out of Their Liquefied Prey → "so much like human toddlers."
Comment analysis for men:
- For the “Least Disgusting” title: there was not a lot of disgust reaction with comments like "just squish it … squash that thing!"
- The “Most Disgusting” title didn’t show a lot of disgust reaction from men.
- The “Original Title” didn’t generate a lot of comments even though it generated better engagements.
See below for screenshots of the conditions in this Facebook ad experiment.
Stereotype threat: Ad Sets
Question: Will including an image of a woman in the thumbnail of our Deep Look episodes encourage more women to click on the link?
Drawing on the research findings from previous studies, having female role models — formal or informal — in STEM fields has been shown to reduce stereotype threat impacts. Stereotype threat is defined as a perceived negative stereotype being reinforced by a particular group (Spencer et al., 1999). For example, there is a longstanding stereotype regarding women and math ability, with some literature finding that this negative stereotype can influence performance of women in standardized testing scenarios. This makes us think: Do women feel like our science videos aren’t FOR them? Even though an earlier CTC study did not find conclusive evidence that having a woman represented in YouTube thumbnails encourages more women to click on an episode, we decided to run a similar test on Facebook to test this hypothesis again. Note that this study used different images than the previous CTC study.
Stereotype Threat: Findings & Learnings
In this experiment, we wanted to be sure to use an episode of Deep Look that featured a female figure. And since the coronavirus was the topic on people’s minds at the time, we decided to test with Deep Look’s coronavirus episode titled “How The Coronavirus Attacks Your Lungs.”
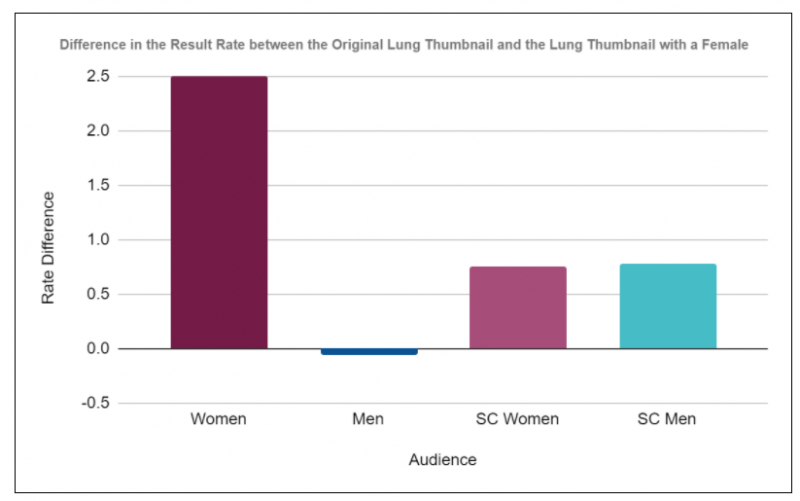
Across all target audiences, the thumbnail that included an image of a woman generated more engagements (based on our measurement of metrics explained above). It is important to note that this difference could be due to seeing a person (versus not seeing a person).
See below for the two conditions of the ad experiment:
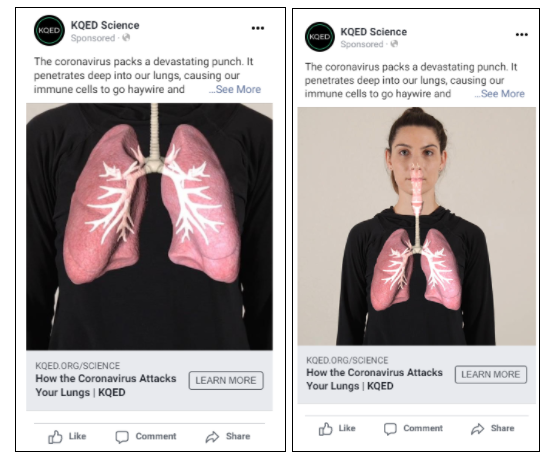
An analysis of the comments posted on these two ads found that:
- Across all audiences, in general, we saw approval for the information in the video.
- Men, in general, were more inclined to comment about the virus being fake, the ineffectiveness of masks, and distrust in health care workers. Although many counterarguments were listed in the comments.
- Women with science and nature interests talked more about masks as a means of protection and encouraged people to wear them.
- Women, in general, approved and said the video was informative.
Title Alteration: Ad Sets
After coding and categorizing 100 Deep Look titles by gender and number of views on YouTube, the Texas Tech research team found that certain titles seem to engage women to watch certain episodes more than others (see CTC Report #4a).
One of the key findings was health/home and sex/mating titles seemed to be of more interest to women than other titles. For a more in-depth description of what we found in the earlier Deep Look titles research, please go here.
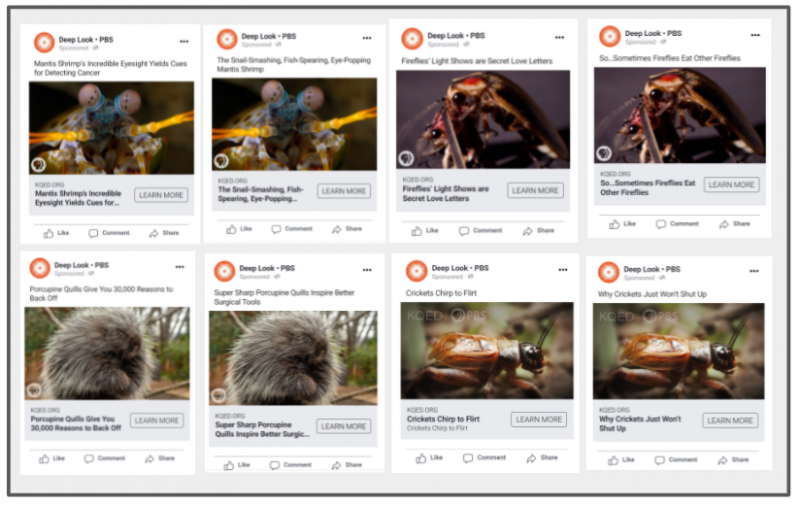
For our Facebook test, we used the same research method by testing different titles, targeting different audiences to see if women did indeed prefer health/home and sex/mating-related titles. See a table below of the different titles used in these tests:
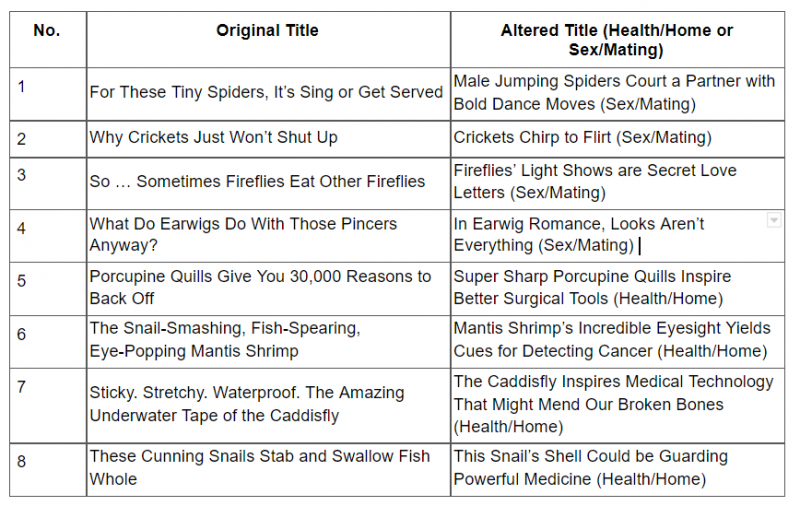
The figure below shows a screenshot of some of our different title tests. Take note that the images for each ad test remained constant.
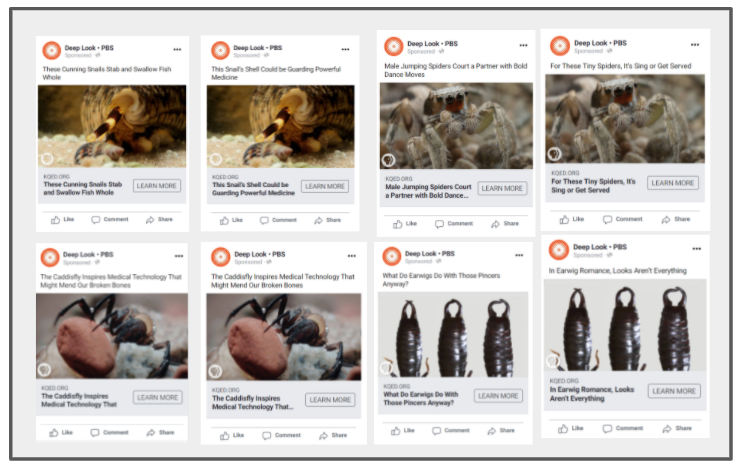
Title Alteration: Findings & Learnings
In general, here are the key takeaways from the Deep Look titles Facebook experiment:
- Women interested in Science and Nature prefer titles with a health/home or sex/mating title in 50% of the test cases. This is more than all the other audiences as described in the “Audiences” section of this post.
- Men and Women, in general, prefer the original titles, except in the case of the Caddisfly and Porcupine episodes.
- Men interested in Science and Nature prefer the original titles, except in the case of the Spider, Caddisfly, and Snail episodes.
Overall Key Takeaways: What Did We Learn in General?
Overall we found these experiments to be very useful in addressing a number of questions that arose during our research. Here’s a refresher list of those key takeaways:
-
- Disgust Sensitivity: Across all audiences, the element of disgust did not really influence engagement for both men and women, and the most popular title was the original one. But the Facebook experiment did show that men were more interested in the “Most Disgusting” titles in comparison to women, who preferred the “Least Disgusting” more than the “Most Disgusting.”
- Stereotype Threat: Across all target audiences, the thumbnail with the woman in it generated more engagements than the image without her.
- Titles: In general, across all audiences, a majority preferred the unaltered, original titles that didn’t have the health/home and sex/mating element in the titles. But women interested in Science and Nature prefer titles with a health/home or sex/mating title in 50% of the test cases. This is more than all the other audiences.
Notes and Reflections: Future Recommendations
When conducting these experiments on Facebook using the advertising tool, it is worth noting that Facebook will favor ads that perform better, according to their algorithms. And this makes it harder to control the experimental environment. In order to try to control this, we capped the same amount of money spent for each target audience in the hopes of ensuring that each audience is served the same number of ads (impressions).
Reflecting on the findings and results of these Facebook tests we conducted for Deep Look, we think that it would be very interesting to execute similar experiments across other social media platforms, see what works for different audiences, and use the findings in our social media distribution plan to maximize engagement. We also learned that our advertising budget for Deep Look specifically is best served by focusing on the Science and Nature inclined audiences on Facebook.
Using the Facebook advertising tool as a research platform has its limitations, but nonetheless, it does provide opportunities for social media producers to experiment with and test different content strategically to target and engage specific audiences.
Result Charts
The following charts show the Result Rate Differences for the Stereotype Threat and Disgust Sensitivity tests.
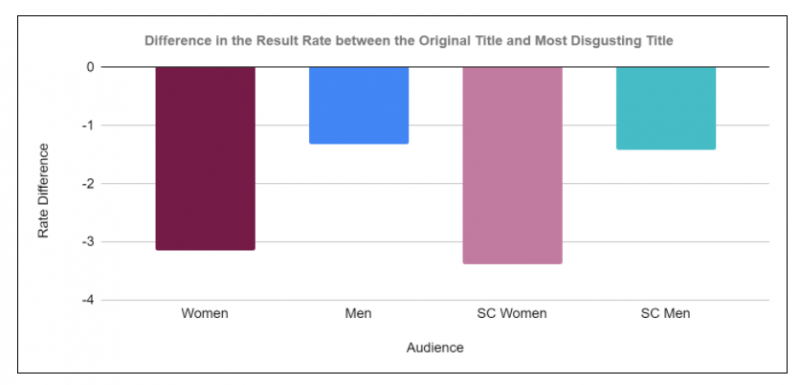
“Turret Spiders” (SC = Science Curious)

“Turret Spiders” (SC = Science Curious)
