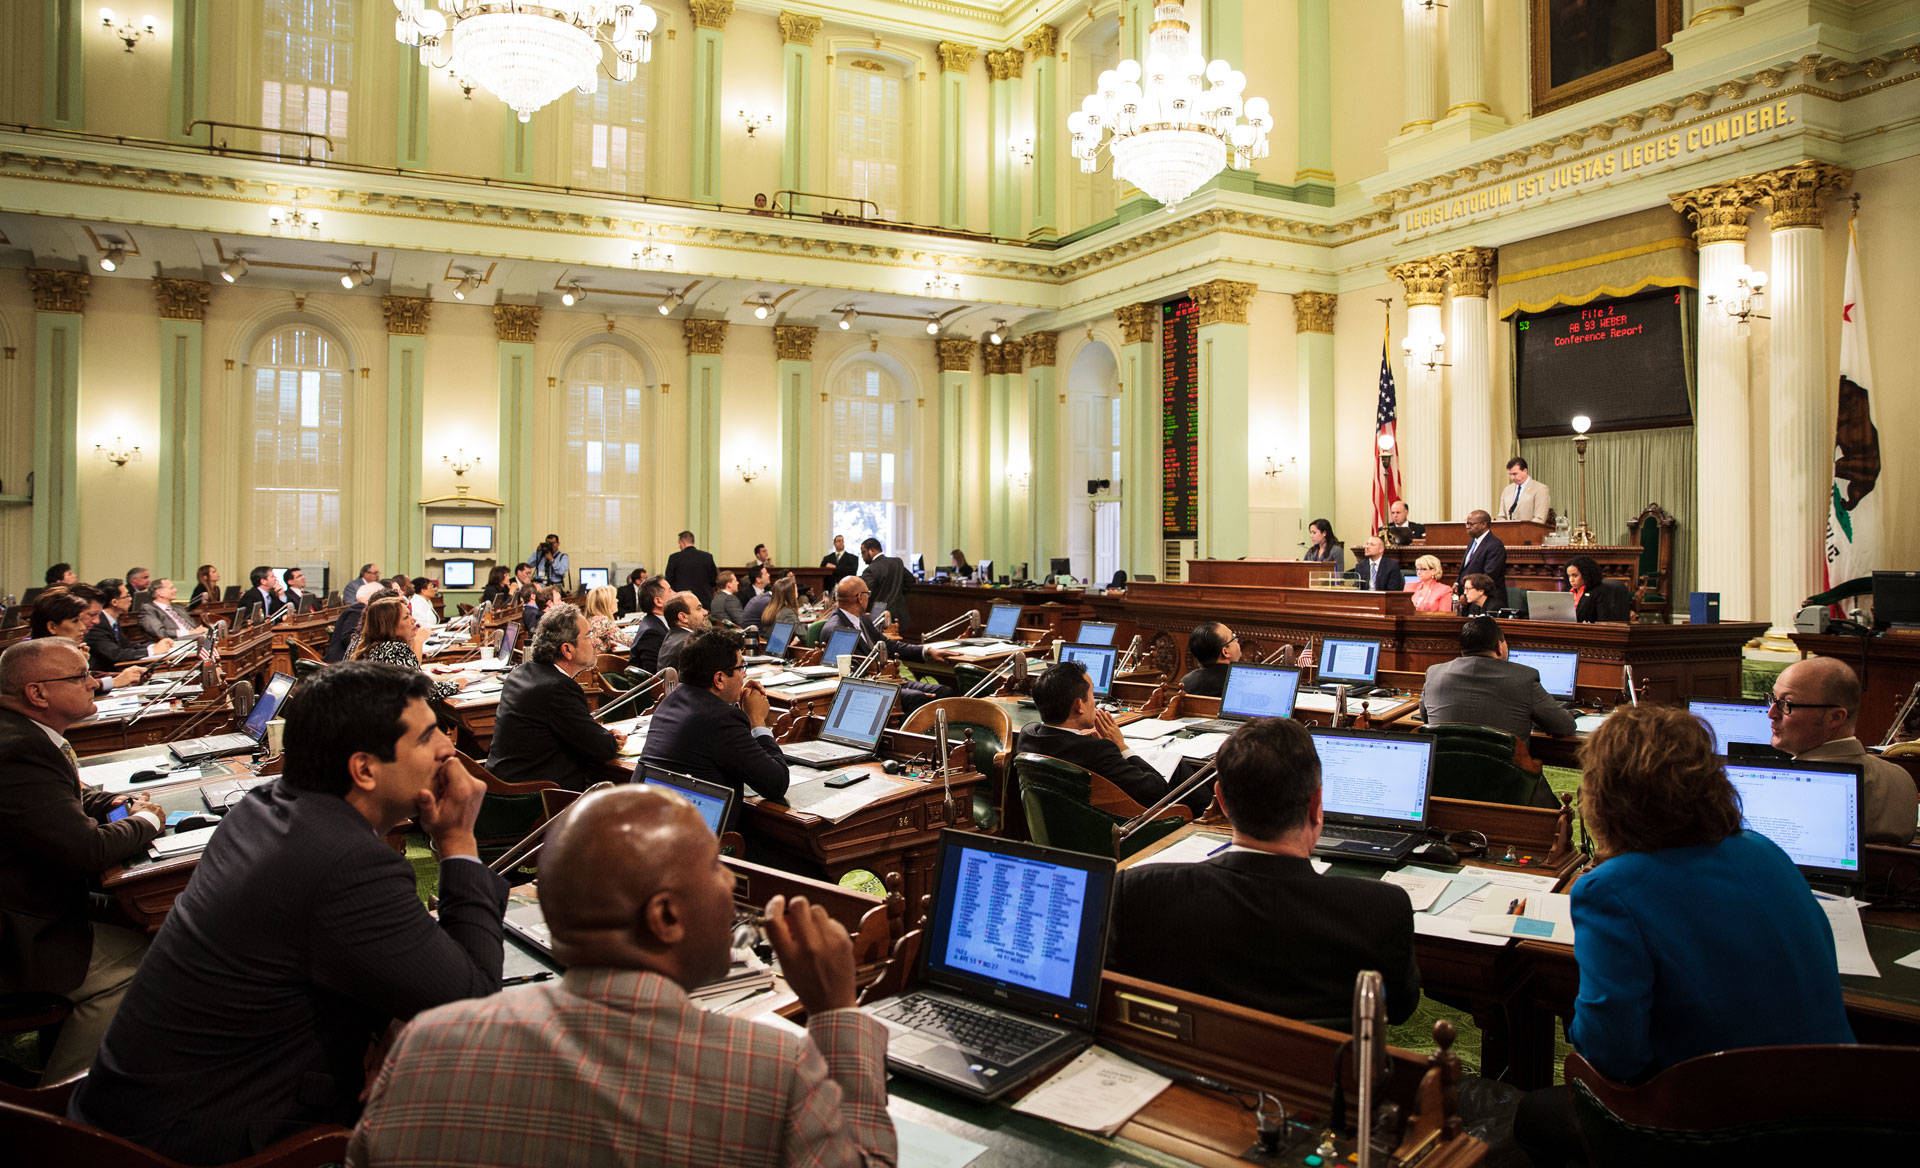
Who’s missing from the Legislature?
- Women: The lack of female legislators is perhaps the most glaring difference between Californians outside of the Capitol and those within it. Twenty-two percent of state legislators are women, the lowest percentage since the early 1990s. Slightly more than half of Californians are female.
- Latinos: While the number of Latino legislators is on the upswing, California’s largest nonwhite ethnic group is still underrepresented in Sacramento. Twenty-three percent of California’s state lawmakers are Latino, compared to just under 40 percent of the population as a whole.
- People Who Make Less Than $100,000: Cheating a little here, but it’s noteworthy that legislators’ salaries put them in an income bracket well above your average Californian. The median income for a California household in 2015 was about $62,000 -- about $40,000 short of what a legislator makes. California legislators are the highest paid of any state lawmakers in the country.
https://infogr.am/52e40045-47ba-4794-8a90-30a36425a2c4
Who’s overrepresented?
- Whites -- and specifically white men -- and very specifically white men named Jim: In a state where 60 percent of the population consists of people of color, just over 45 percent of lawmakers are non-white. White males alone account for nearly half of the Legislature.
- People in their 40s, 50s and 60s: Baby Boomers and Gen Xers dominate the California Legislature. While Californians under age 40 comprise about 40 percent of the state’s adult population, they make up only 23 percent of lawmakers. Part of that is simply a function of experience -- it’s hard to have a compelling political resume in your 20s. But a handful of young legislators are challenging that norm.
- Gays and Lesbians: Although it’s difficult to get a precise count of LGBT people in California, one well-respected estimate places the proportion at about 4.6 percent of the population. Eight state lawmakers are openly gay, making up nearly 7 percent of the Legislature. There are, however, no transgender legislators.
https://infogr.am/7a6fb5c1-2597-459e-8c52-e286aaa0ea6a
It’s one thing to look at the diversity (or lack thereof) of lawmakers in a vacuum. But how does the California Legislature compare to those of other large states with diverse populations?
The chart below contrasts the ethnic demographics of California, Texas, Florida and New York with the demographics of their state legislators. In this context, California legislators appear much more reflective of their communities than those of Texas, the state with the second-largest Latino population in the country. However, the proportion of nonwhite state legislators from New York and Florida more closely matches the demographics of their states than is the case in California.
https://infogr.am/5f74b9f8-93d6-47a0-85a4-062650026d88
Of course, the question of how well legislators reflect their constituents extends well beyond any legislator’s ethnicity, gender or sexual orientation. And just because a legislator mirrors the demographic profile of a given voter does not mean that lawmaker necessarily reflects that voter's ideological disposition, nor does it mean he or she is an especially effective legislator.
Let's just hope the name "Jim" is associated with good policymaking.
https://infogr.am/f4f8eef7-238a-42d2-b2ff-25b48dd41d4b
CALmatters.org is a nonprofit news venture devoted to covering state policy and politics.
